NZ Election 2026: Mongrel Mob Controversy, Fiscal Policy and Greens on social media
A weekly tracker tracing the stories, figures and policies driving media and social coverage in the 2026 New Zealand General Election across Online News, TV, Radio, Newspaper, Magazine, X, Facebook, Instagram, TikTok, Threads and Forums. This edition covers conversations and coverage from 8th – 15th October, highlighting what’s shaping the election conversation.
1. Election Conversation
18,417
total mentions this week
4,479 media13,938 social
Media = news coverage. Social = all public posts across X, Facebook, Instagram, TikTok, Threads and Forums – everyone posting, not just media outlets.
2. Media Issue of the Week
Green and Te Pāti Māori MPs Draw Criticism Over Meeting With Mongrel Mob Members
Greens / Te Pāti Māori112 media items · 116 social posts
Candidates and sitting MPs from the Green Party and Te Pāti Māori attended a meeting with Mongrel Mob members at a gang address. When photographs from the meeting were shared on social media, the response from commentators and rival parties was swift and largely critical.
This was not the week’s highest-volume story, accounting for only 112 of 4,479 media items (2.5%, after filtering out unrelated international content) and 116 of 13,938 unique social posts (0.8%, after collapsing retweet/repost duplicates down to one count per message), well below the volume generated by ongoing leaders’ debate coverage, which totalled 1,125 media items. Two independent methods nonetheless support treating it as a genuine, separable story: an exact keyword count aligns closely with an unsupervised clustering analysis of the entire media population, which identified it as a distinct 47-item cluster – smaller than general campaign coverage and several specific policy announcements, but clearly distinguishable from them. What sets the story apart is the intensity of the reaction rather than its scale: 72% of social commentary on the topic was negative, the most one-sided sentiment recorded for any subject this week, and the average post attracted roughly 5.7 times the typical level of engagement. Taken together, these figures point to a genuine public reaction concentrated on social platforms, and the episode provides National and ACT with a law-and-order narrative that may continue into coming weeks. It has not been linked to a tracked party policy below, as it reflects a matter of conduct rather than a policy position.
3. What’s happening across media and social?
4,479 media items · 13,938 social items · share of each channel’s own conversation, so the two bars are directly comparable
“Social” is all public posts across X, Facebook, Instagram, TikTok, Threads and Forums – not just media organisations’ own accounts.
MediaSocial
Issues
Cost of Living
Media
15.8%
Social
22.7%
Economy & Jobs
Media
19.4%
Social
17.5%
Health
Media
11.7%
Social
9.9%
Infrastructure & Transport
Media
11.4%
Social
5.2%
Law & Order
Media
5.3%
Social
10.6%
Parties
National
Media
30.9%
Social
27.5%
Labour
Media
25.3%
Social
21.6%
NZ First
Media
14.7%
Social
21.5%
Greens
Media
14.1%
Social
20.4%
ACT
Media
6.8%
Social
6.4%
The most active commentary this week came from Sean Plunket, the Chris Chang and Tova O’Brien pairing, and John MacDonald.
By follower reach, the most prominent social accounts posting about the election this week were major outlets’ own accounts – the New Zealand Herald, 1News, RNZ, Stuff and Radio Tarana – alongside the official Labour Party account. Individual leaders’ personal accounts posted actively but with smaller followings than these outlet and party accounts.
The Greens continue to receive disproportionately greater attention on social media relative to traditional news coverage, accounting for 20.4% of social party conversation compared with 14.1% in media coverage – roughly 1.4 times the media share.
Law and order shows a similarly pronounced gap between channels this week, accounting for 10.6% of social conversation compared with 5.3% in the news. This is consistent with the public reaction to the Mongrel Mob meeting, which appears to have generated considerably sharper engagement on social platforms than mainstream coverage volume alone would suggest.
4. Party Share of Conversation
1. National33.1%
2. Labour26.6%
3. NZ First20.6%
4. Greens19.7%
Shown for the four largest parliamentary parties (National, Labour, Greens, NZ First); ACT, Te Pāti Māori and TOP are tracked elsewhere in this report but not included in this chart, so these shares sum to 100% of the four shown, not of all tracked parties. Share of conversation measures attention and mentions only – it is not polling and should not be read as an indication of electoral success.
5. Top candidates this week
1. Winston Peters1,931
2. Christopher Luxon1,631
3. Chris Hipkins1,466
4. David Seymour916
5. Chloe Swarbrick561
Winston Peters leads the rankings this week, a shift driven primarily by a widely circulated moment in the minor-party leaders’ debate in which he described diversity as “a weakness rather than a strength” while delivering a pointed critique of the left-leaning bloc. Christopher Luxon and Chris Hipkins follow closely behind as the campaign moves into its final weeks, while David Seymour and Chloe Swarbrick complete the top five, each drawing attention largely through their parties’ own policy announcements this week.
6. Election Issues
Top 4 themes this week
Economy & Jobs3,014
Cost of Living2,901
Health1,789
Infrastructure & Transport1,508
What’s driving conversation about each party?
Each major party’s top-ranked issues this week, by real topic volume in their social conversation (after excluding other parties’ names, individual people, and procedural or horse-race chatter), with how that conversation leaned
NegativeNeutralPositive
National
Cost of living · 86 items
Neg 46.5%Neu 31.4%Pos 22.1%
Tax reform · 34 items
Neg 44.1%Neu 52.9%Pos 2.9%
Fiscal plan · 42 items
Neg 38.1%Neu 57.1%Pos 4.8%
Labour
Cost of living · 88 items
Neg 30.7%Neu 36.4%Pos 33%
Fiscal plan · 47 items
Neg 55.3%Neu 34%Pos 10.6%
Economy · 70 items
Neg 34.3%Neu 48.6%Pos 17.1%
Greens
Wealth tax · 41 items
Neg 53.7%Neu 34.1%Pos 12.2%
Cost of living · 43 items
Neg 27.9%Neu 41.9%Pos 30.2%
Jobs · 112 items
Neg 34.8%Neu 33.9%Pos 31.2%
ACT
Fiscal plan · 24 items
Neg 50%Neu 37.5%Pos 12.5%
Volume and sentiment above are based on social media data only.
7. Issues to Watch
The meeting between Green and Te Pāti Māori representatives and Mongrel Mob members represents a reputational risk for both parties heading into the final weeks of the campaign. Whether National and ACT are able to sustain this as a law-and-order narrative through to the 7 November election is worth monitoring closely.
Labour’s fiscal plan issue recorded the most negative social sentiment of any tracked policy this week, at 55.3% negative, followed by Greens’ wealth tax at 53.7% and ACT’s fiscal plan at 50.0%. All three touch on tax, spending or fiscal policy specifically, suggesting the fiscal debate is where social sentiment is running most negative across the board this week, rather than any one party facing an isolated problem.
Social media discussion of the Greens continues to centre on polling performance and tactical voting considerations rather than policy substance. Coalition and tactical-voting framing accounts for 12.7% of their social conversation this week, compared with just 2.2% focused specifically on their wealth tax proposal – a pattern that has now held for three consecutive weeks. Whether that balance shifts as the campaign enters its final stretch would be worth tracking.
If you want to find out more about how Isentia can help you understand the NZ media landscape, please reach out to us here.
Nikita Gundala manages brand marketing and thought leadership for Pulsar Group across the SEA and ANZ markets. With over three years of first-hand experience in the influencer marketing and PR industries, she specializes in translating real-time insights and audience intelligence into actionable content. Nikita holds a master’s in Marketing and Digital from ESSEC Business School, Singapore. She has contributed to the wider industry conversation by co-authoring articles and reports for The Business Times Marketing Interactive.
A weekly tracker tracing the stories, figures and policies driving media and social coverage in the 2026 Victoria State Election across Online News, TV, Radio, Newspaper, Magazine, X, Facebook, Instagram, TikTok, Threads, Blogs and Forums. This edition covers conversations and coverage from 2nd November - 10th November 2026, highlighting what’s shaping the election conversation.
1. Election Conversation
12,796
total relevant mentions this week (5,439 media + 7,357 social)
Media figures cover news coverage of the Victorian state election across TV, radio, newspaper, magazine and online news, while social figures cover public posts from everyone, not just media outlets, across X, Facebook, Instagram, TikTok, Threads, Forums and Blogs. The two are counted separately and added together, with no overlap between them.
2. Media Issue of the Week
Big Build Royal Commission Hearings Dominate Election Lead-Up
Labor452 media items · about 1 in 12 election news items
The Royal Commission into Victoria's Big Build projects began public hearings on Monday, November 6, immediately putting the spotlight on Labor's signature infrastructure program. Counsel assisting the commission, Michael Borsky KC, framed the Sunbury level crossing removal project as a 'case study' of union influence, alleging former premier Jacinta Allan's office pressured builders in June 2022 to 'accede to the demands' of the CFMEU during a costly industrial dispute. Throughout the week, testimony and evidence submissions pointed to broader scrutiny of projects like the West Gate Tunnel, with the commission's terms of reference explicitly targeting corruption, criminal infiltration, and multi-billion dollar cost blowouts. By Thursday, it was confirmed both Allan and her predecessor Daniel Andrews would be called to give evidence, so the inquiry is likely to remain in the news through the campaign.
For Labor, the hearings put scrutiny on its record of delivering major infrastructure. The commission was established by Premier Ben Carroll's government, and its hearings examine the cost and management of projects at the centre of that record. The Opposition has pointed to evidence about union pressure and budget overruns in arguing that the government cannot be trusted with major projects. For communications teams, the hearings show how an official inquiry can take up a large share of campaign coverage and keep a government responding to detailed evidence.
The story led media coverage all week, generating over 450 articles and featuring heavily on talkback radio from 3AW to 2SM. The Government Integrity & Accountability theme it falls under took about 13% of social conversation, a smaller share than its news footprint. Coverage was driven by daily reporting on testimony and evidence rather than a single moment on social media. For organisations, it shows how official inquiries can generate sustained coverage over many weeks.
3. What's happening across media and social?
How the same issues and parties are landing in the news versus in public conversation
MediaSocial
Issues
Campaign & Election Process
Media
36.6%
Social
56.2%
Government Integrity & Accountability
Media
20.0%
Social
13.2%
Crime & Community Safety
Media
21.3%
Social
10.1%
Cost of Living & State Finances
Media
4.7%
Social
5.8%
Transport & Infrastructure
Media
4.4%
Social
1.9%
Parties
Labor
Media
83.7%
Social
46.0%
Liberal
Media
66.0%
Social
35.1%
One Nation
Media
42.7%
Social
41.9%
Nationals
Media
45.0%
Social
6.7%
Greens
Media
21.5%
Social
8.4%
Campaign & Election Process is a bigger talking point in public conversation than it is in the news.
4. Party Share of Conversation
Combined share of media + social mentions this week — attention, not polling
1Labor
32.6%
2Liberal
25.3%
3One Nation
22.2%
4Nationals
12.0%
5Greens
7.4%
6Independent
0.5%
Shares add up to 100% of the six parties shown. Share of conversation measures how much each party was mentioned across media and social this week, not polling, voter intention or electoral support.
5. Top candidates this week
Ranked by combined media + social mentions · share of mentions among the five candidates shown
1Jess Wilson Liberal · Opposition Leader
37.8%
2Ben Carroll Labor · Premier
37.0%
3Warren Pickering One Nation · One Nation leader
12.0%
4Jacinta Allan Labor · former Premier
9.2%
5Daniel Andrews Labor · former Premier
4.0%
Mentions measure attention, not popularity, approval or electoral prospects.
6. Election issues
Top themes this week
Top themes this week, media + social combined · share of mentions among the four themes shown
1Campaign & Election Process
56.9%
2Government Integrity & Accountability
19.1%
3Crime & Community Safety
17.7%
4Cost of Living & State Finances
6.3%
What's inside each topic?
The specific stories driving each theme above, as a share of that theme's own coverage
Campaign & Election Process
Preference deals
8%
Polling numbers
5%
Personal attacks
4%
Vote intention chatter
3%
Other stories
80%
Government Integrity & Accountability
Construction Royal Commission
34%
Government corruption allegations
4%
Royal Commission legal costs
2%
One Nation costings refusal
1%
Other stories
59%
Crime & Community Safety
One Nation volunteer assault
30%
Youth offender rehabilitation
6%
Illicit tobacco crackdown
6%
Aidan's Law police pledges
4%
Other stories
54%
Cost of Living & State Finances
State debt criticism
12%
Government spending criticism
3%
Make It Here Fund
3%
Election costings dispute
2%
Other stories
80%
What's driving conversation about each party?
Each party's top issues in social conversation this week, other than campaigning and election process — which is the single biggest topic for every party, but is excluded here to surface substantive policy issues
Labor
1Government Integrity & Accountability
2Cost of Living & State Finances
3Crime & Community Safety
Liberal
1Government Integrity & Accountability
2Cost of Living & State Finances
3Health & Hospitals
Nationals
1Crime & Community Safety
2Cost of Living & State Finances
3Health & Hospitals
Greens
1Government Integrity & Accountability
2Crime & Community Safety
3Cost of Living & State Finances
One Nation
1Crime & Community Safety
2Government Integrity & Accountability
3Immigration & Multiculturalism
7. Top election promises
This week's most-covered costed pledges, media + social combined
Cross-party
Parties Make Competing Police and Station Pledges
224 media · 23 social
Cross-party
Parties Commit to 'Aidan's Law' for Harsher Sentencing
221 media · 21 social
Labor
Labor Proposes 'Tough Love' Youth Detention Plan
175 media · 16 social
8. Where the coverage came from
Media type and social platform split this week
Media type
5,439
Online News67%
AM Radio10%
TV9%
Newspaper8%
Other (FM Radio, Magazine)6%
Social platform
7,357
X82%
Facebook Pages13%
Instagram Public, TikTok, Other (Forums, Threads, Blogs)5%
Top outlets: News24, 3AW, ABC Radio Melbourne Most active accounts: Commoncents21, CrogerParody, Dedicatedlyfirm
9. Issues to watch
What communicators should keep an eye on next week
Monitor the Coalition's positioning on One Nation, as they rule out a formal deal but face scrutiny over preferences and policy alignment; communicators should watch for any mixed messages that could undermine their credibility or shift the campaign narrative away from their core agenda.
Track public reaction to the assault on a One Nation volunteer, which could elevate community safety as a dominant campaign issue; this may pressure all parties to harden their law-and-order messaging and could influence voter sentiment on the broader integrity of the election process.
Watch for how parties navigate the ongoing Royal Commission into the Big Build, as hearings dominate media coverage; this will test their ability to manage reputational risk on government accountability while pivoting to promote their own infrastructure and spending promises.
If you want to find out more about how Isentia can help you understand the Victoria state election media landscape, please reach out to us here.
"
["post_title"]=>
string(88) "Victoria State Election 2026: Big Build Inquiry, Campaign Debate and One Nation in Focus"
["post_excerpt"]=>
string(168) "Explore how the Big Build Royal Commission, election campaigning and public safety shaped media coverage and social conversations during Victoria's 2026 state election."
["post_status"]=>
string(7) "publish"
["comment_status"]=>
string(4) "open"
["ping_status"]=>
string(4) "open"
["post_password"]=>
string(0) ""
["post_name"]=>
string(47) "victorian-election-2026-big-build-media-tracker"
["to_ping"]=>
string(0) ""
["pinged"]=>
string(0) ""
["post_modified"]=>
string(19) "2026-11-13 01:51:21"
["post_modified_gmt"]=>
string(19) "2026-11-13 01:51:21"
["post_content_filtered"]=>
string(0) ""
["post_parent"]=>
int(0)
["guid"]=>
string(32) "https://www.isentia.com/?p=51016"
["menu_order"]=>
int(0)
["post_type"]=>
string(4) "post"
["post_mime_type"]=>
string(0) ""
["comment_count"]=>
string(1) "0"
["filter"]=>
string(3) "raw"
}
Blog
Victoria State Election 2026: Big Build Inquiry, Campaign Debate and One Nation in Focus
Explore how the Big Build Royal Commission, election campaigning and public safety shaped media coverage and social conversations during Victoria’s 2026 state election.
How do I navigate aged care in Australia? How easy are government services to deal with? How well supported are people with disabilities? These are big questions about life in Australia, and many people now put them to an AI tool before they visit a website, pick up the phone or speak to anyone. They rarely mention a government agency by name, yet the answer they get still shapes what they believe about the services behind it: whether the system works, who is responsible and whose information they can trust. That is reputation taking shape, in a conversation no communications team is part of.
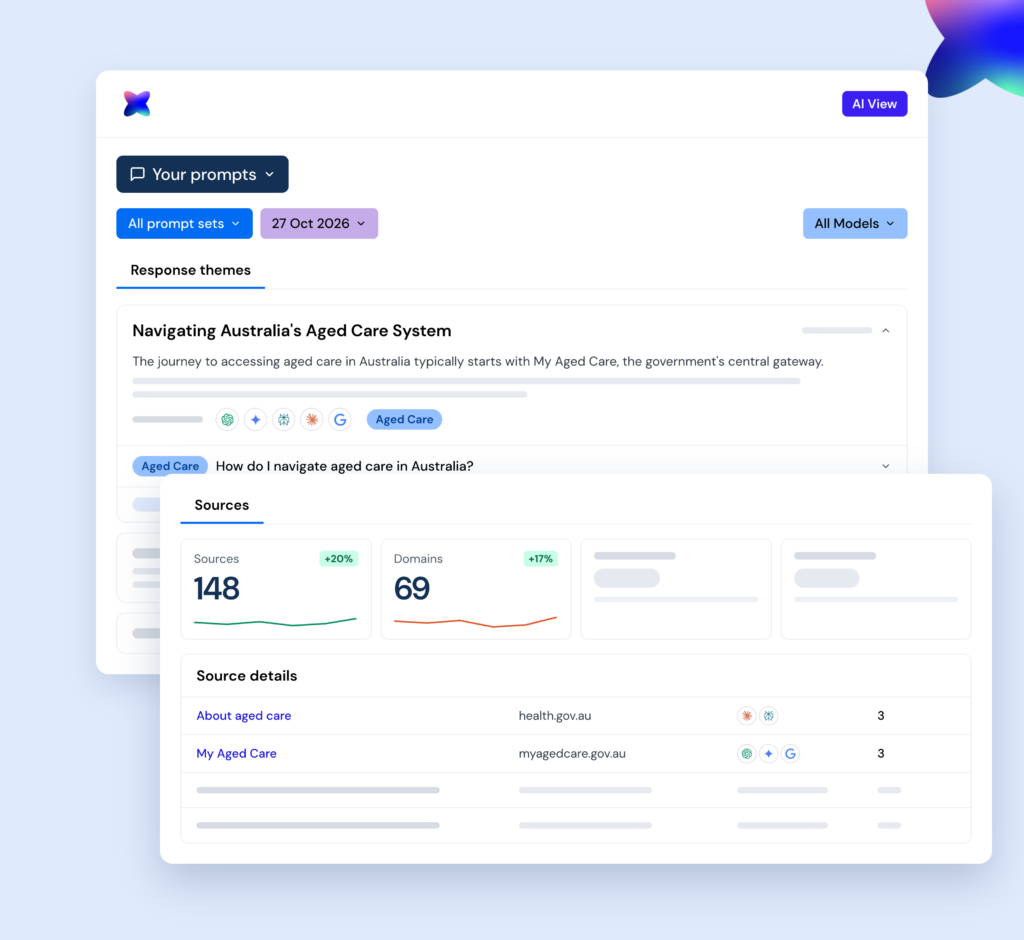
To see how that plays out, we used Your Prompts, a new feature in Isentia's AI View, to track how leading AI models answer these questions. Here's what we found, whose information the models used, how each model goes about sourcing its answers, and what it all means for public-sector communicators.
Starting with the question
Most AI visibility tracking starts with an organisation's name. Your Prompts lets you set your own questions, which gives public-sector teams a much wider view of their reputation. People rarely ask an AI tool about an agency by name; they ask for help with whatever problem is in front of them, whether that's getting a parent into aged care or working out what support is available for a carer. Or they ask something bigger, such as how well the country looks after older people.
We tracked six sets of questions across leading AI models, covering the things people deal with at different stages of life: finding their way around government services, getting older, living with disability and caring for someone, raising a family, staying healthy, and making ends meet. For this article we focused on three of them: access and navigation, aged care, and disability and carers. These are the moments when people depend most directly on the government, which means a wrong or incomplete answer can have real consequences for someone trying to get help, and can colour how they feel about the system as a whole.
We compared answers from ChatGPT, Claude, Gemini, Perplexity and Google AI Overview, looking at what each model said, which sources it cited and which organisations it named. The questions were set up for tracking rather than drawn from a survey of what the public actually asks, and the findings reflect a single point in time, using the latest data from 27 October 2026. Even so, the patterns in how AI finds and presents information about public services were clear and consistent.
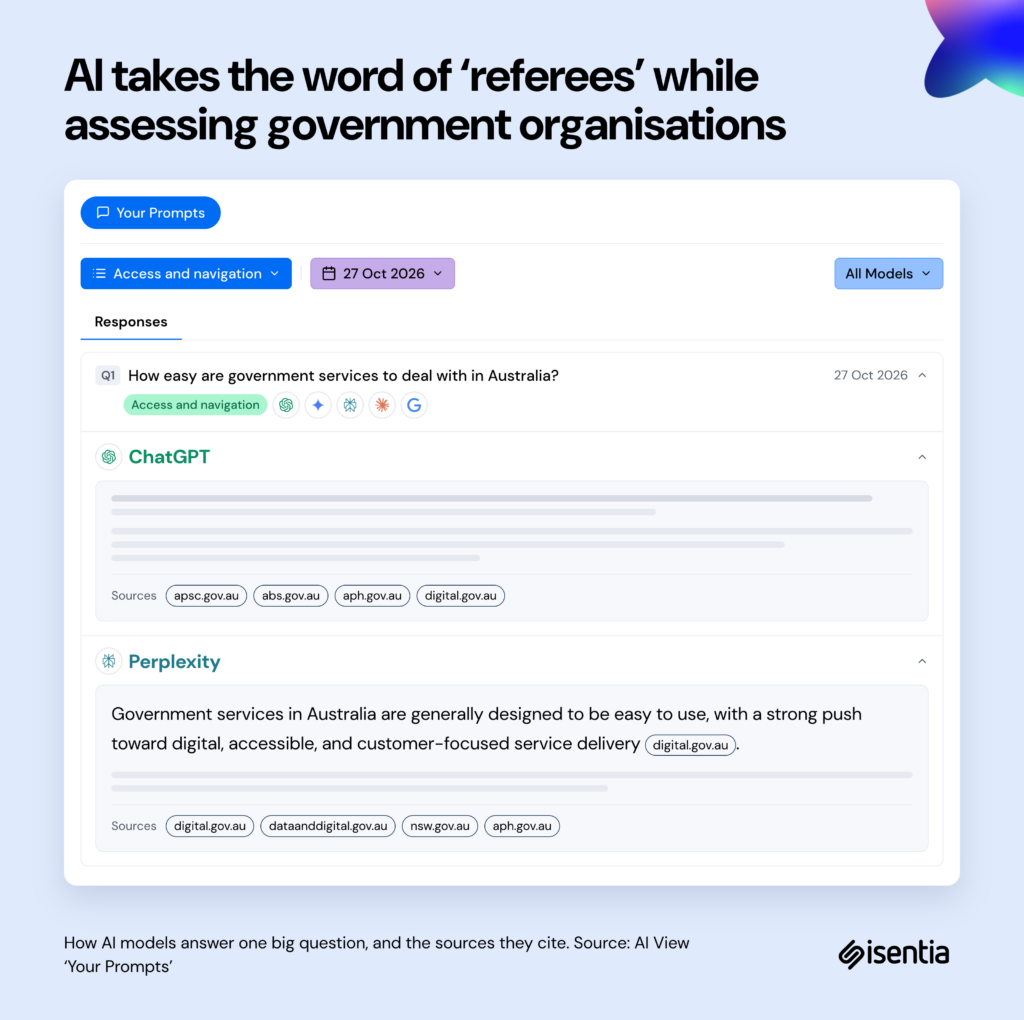
How easy are government services to deal with in Australia?
We asked this alongside a second question: how well government support reaches the people who need it. Most models landed on a similar view: digital services work well for simple tasks, while complex cases, phone contact and people in vulnerable situations are where things get harder. The more interesting part is where that view comes from. The models formed it largely through oversight bodies, with the national audit office's findings carrying particular weight.
Government's own voice only came through when a model cited official pages, as when one model described digital services as a major strength, using a government website as the source. In other words, when AI assesses how the government is performing, it largely takes the word of the ‘referees’. Owned content can earn you a line in the answer, but auditors, commissions and advocates write most of the scorecard. For reputation, that gives an audit finding a second life. Well after the news cycle moves on, it can still be part of the answer people get when they ask how the government is doing. That brings us back to a question we raised in our article on AI visibility for government agencies: is your organisation still seen as the main authority on its own services?
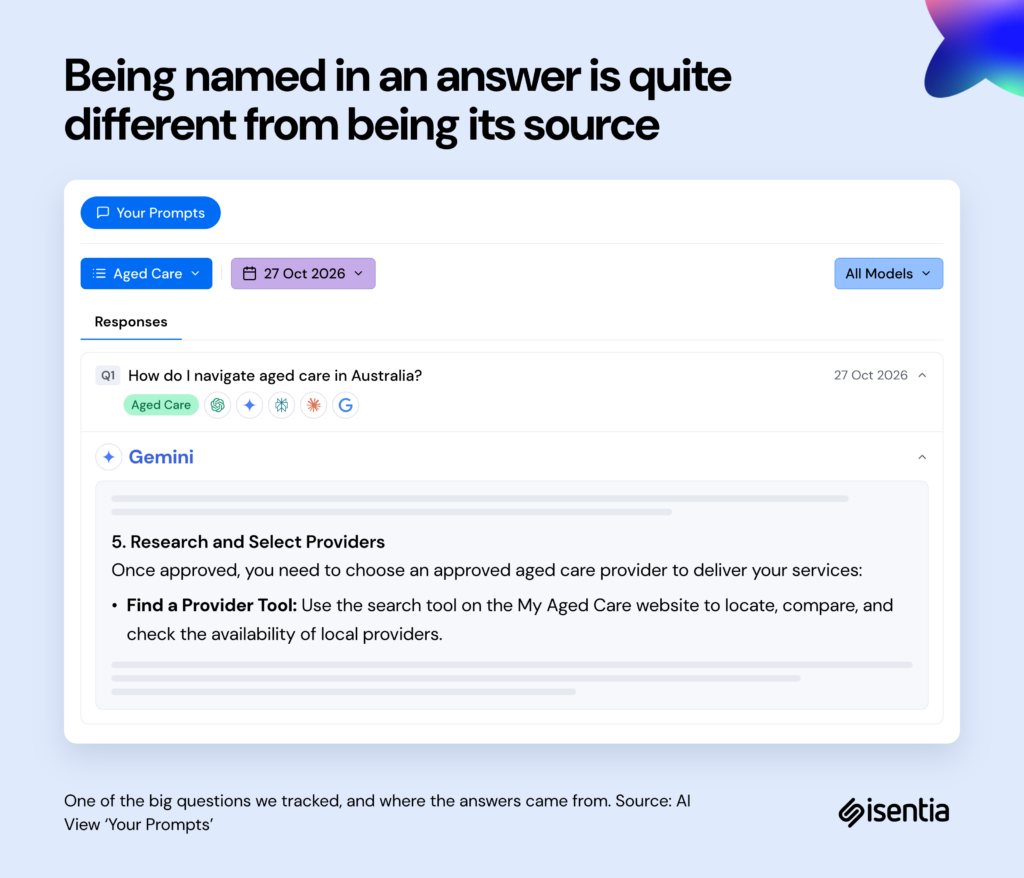
How do I navigate aged care in Australia?
Almost every model named government services as the place to go for financial assessments, payments and in-person help, and the tone was neutral to positive. One model went as far as recommending that people complete a means assessment early so they don't end up paying more than they need to.
The catch is that the agencies people were being sent to were rarely the source of that information, which mostly came from other government portals and guides written by aged care providers and advocacy groups. In one answer, even an agency's own contact details were taken from a seniors' advocacy group's website. Being named in an answer, then, is quite different from being its source. It builds recognition, but someone else is setting people's expectations of what they'll find when they get there, and if that guide is out of date, it's the service they feel let down by.
Zoom out to the bigger question of how well Australia looks after older people, and the agencies that were the first port of call in the practical answers didn't appear at all. These answers were framed by the Royal Commission into Aged Care Quality and Safety, which concluded in 2021, with most models opening on its findings and some giving them more weight than the reforms that followed. This is the reputational point that's easiest to miss: the practical question tells people where to go, while the big question tells them what kind of system they're dealing with. As we covered in why content freshness matters for AI visibility, old stories have a habit of shaping AI answers long after the facts have moved on.
How well supported are people with disabilities in Australia?
The models discussed income support payments without naming the agency that delivers them, focusing instead on the NDIS and the gaps in support. That said, not every absence is a problem. Some questions genuinely aren't about a particular organisation, so it makes sense for it to sit them out. The useful distinction for communicators is between a relevant absence, where the question simply isn't about you, and a missed opportunity, where your work is being discussed and you aren't getting the credit. Repeated across enough answers, a missed opportunity leaves people with a picture of support that doesn't include the people delivering it.
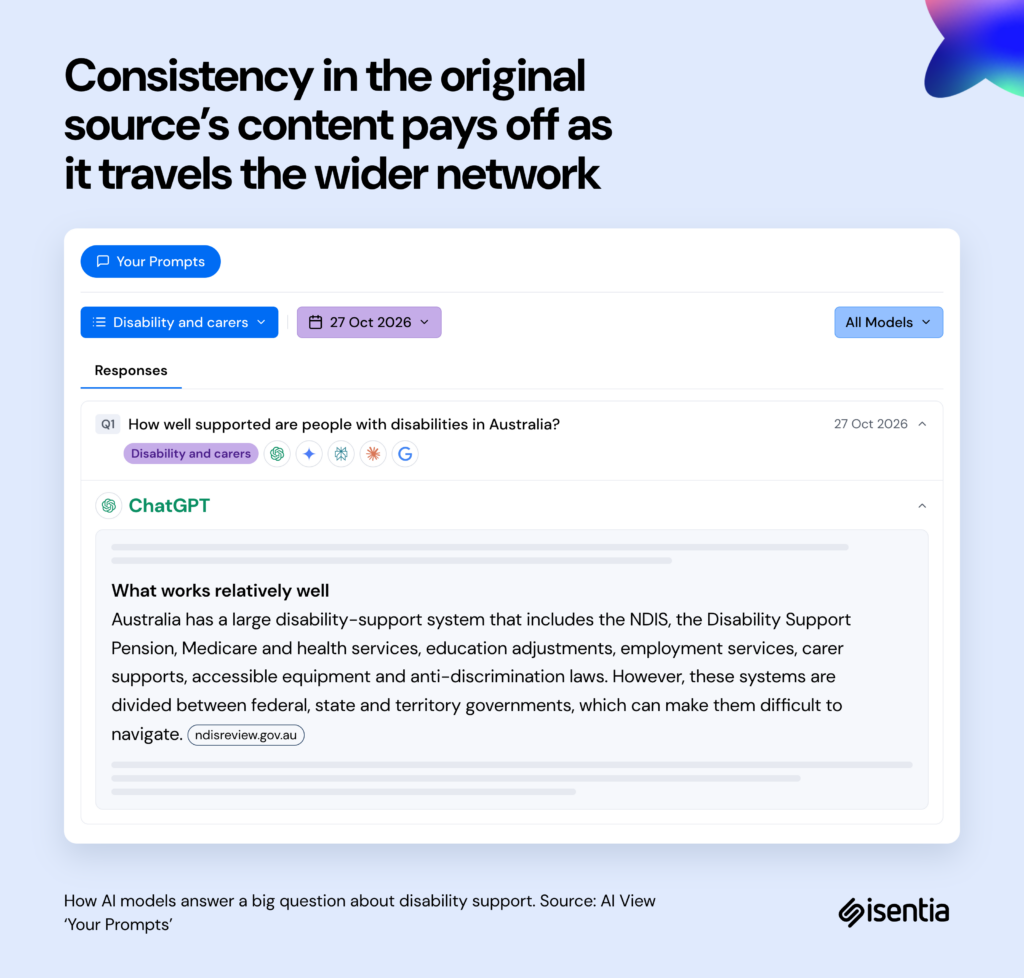
Questions about caring for someone played out differently. Every model gave almost the same answer and pointed people to the same national carer support service. When official information is clear and consistent across agencies, peak bodies and support services, AI repeats it faithfully. There was one notable exception, where a model explained the government's carer payments using a blog from a private company that sells personal medical alarms. The information was mostly accurate, but it shows how far an explanation can travel from its original source. The good news is that consistency across your wider network really does pay off: when the organisations around you describe your services the way you do, AI is more likely to get them right, and that shared story becomes part of your reputation.
Why each model tells the story differently
Across all three categories, each model showed clear habits in the sources it reached for. We can see what each one cites, even if we can't see exactly how it decides, and the patterns are consistent enough to act on. In practice, your reputation can look different depending on the tool someone uses. These habits also build on what we found when we looked at how different LLMs represent your organisation.
Model
Where it gets its information
Example from our research
What it means for communicators
ChatGPT
Official statistics, audit reports and formal reviews. It pairs almost every claim with a figure or finding, much like a policy analyst writing a briefing note.
When asked whether government support reaches people in need, it built its answer around the national audit office’s findings. It was also the model most likely to cite the website of the agency delivering a service.
Oversight reports shape how ChatGPT judges your performance, while your own pages shape how it describes what you do.
Claude
The widest mix of sources, including advocacy groups, provider guides and commentary alongside government material. It tends to explain the reasons behind an issue and present more than one side.
When describing the Royal Commission’s “national disgrace” finding, it relied mostly on second-hand accounts of the report, such as Wikipedia and a private aged care provider’s website.
The organisations that retell your story effectively become your spokespeople.
Gemini
University research and international bodies such as the OECD, drawn from Google’s broad index of academic platforms, video and international sources.
On aged care, it drew on an overseas policy institute’s summary of Australia’s new aged care legislation.
Published research and evaluations carry real weight, as do secondary sources describing your work, wherever in the world they are published.
Perplexity
The most recently updated pages, quoted closely. It is built around live search with visible citations, so it favours recent, easy-to-access pages.
On access to services, it quoted a government corporate plan published only weeks earlier.
This is where keeping your own content current pays off fastest.
Google AI Overview
A small number of sources, summarised briefly, because it is designed to give a quick answer at the top of search results.
On disability support, it relied mainly on the scheme’s own website and summarised criticism in general terms, without naming who made it.
The few sources it chooses carry a lot of weight, so clear, well-structured official pages give you the best chance of being one of them.
One question, several versions
Put together, the same question can produce an audit-style answer, an advocacy-informed analysis, a research summary or a current snapshot, depending on which tool someone happens to open. Two people asking the same question can come away with quite different impressions of the same service. There's no single AI view of an organisation to manage, because each model has its own sources and each needs a slightly different approach.
Zooming out: how these answers add up to reputation
Look at any one of these answers and it can seem like a visibility issue. Put them together and it's a reputation issue. For public-sector organisations, reputation has always been about more than what's said about you by name. It rests on whether people believe the system works, know where to turn and trust what they're told, and those impressions are now forming in AI answers, one question at a time.
Across these questions, four things shaped the impression an answer left:
Who gets named. Whether you appear when your work is being discussed, and get the credit for it.
Who does the explaining. Whether people hear how your services work from you, or from a provider, an advocate or a company blog.
Who acts as referee. Whose assessment of your performance gets repeated as the verdict.
Which story sets the frame. Whether the answer opens on where things stand today, or on a finding from years ago.
None of this shows up if you only ask AI about your organisation by name. You see it when you ask the questions your audience is asking. And it matters, because AI is now one of the main places where people go for information about the things that matter to them.
What this means for public-sector communicators
Government organisations can't control what AI says, but they can do a lot to influence the information it draws on, and with it the reputation that forms around them. Five practical steps came out of this research.
Track the big questions, not just your name. The most useful insights came from questions about services and real-life situations rather than about any one organisation, so start with what your audience is trying to do or understand, and check what AI is telling them.
Work with the bodies that assess your performance. Auditors, commissions and advocates shape how AI judges your work, so respond to their findings publicly and make sure your progress is recorded in the sources they, and AI, rely on. That way an old finding doesn't have to stand alone.
Support the organisations that explain your services. Sister agencies, peak bodies, providers and advocacy groups often explain your services for you, so give them clear, current information to work from. As we found in our analysis of Tier 1 and Tier 2 media in AI answers, specialist and niche sources often matter more to AI than their profile suggests.
Keep practical information clear and up to date. Plain-language pages on eligibility, processes and how to get help are what AI repeats when people ask how to do something. Organisations that deliver services directly rely on this more than most, because outdated information can lead someone to miss out on support they're entitled to.
Check answers across several models regularly. Each model uses different sources, so one model's answer is a poor guide to the others, and because answers shift as new content is published, regular tracking shows whether your updates are reaching the sources AI uses.
Whose information is AI using?
AI is already answering big questions about life in Australia, whether or not the public-sector organisations involved are part of the conversation. This research shows that an organisation can be mentioned often and still have surprisingly little say in how its services are described or how its performance is judged, with other organisations doing much of the explaining and each AI model weighing those voices differently.
For communicators, the job is to understand that wider network of sources and make sure accurate, current information runs through all of it. It's worth asking what AI says about your organisation. It's just as worthwhile asking what AI says when nobody mentions you, and whose information it's using to say it. That's where much of your reputation is now taking shape.
Want to see what AI tells people about the questions that matter to your audience? Get in touch about AI View.
"
["post_title"]=>
string(63) "How do LLMs represent public services to the public they serve?"
["post_excerpt"]=>
string(150) "Learn how AI cites government organisations, whose sources shape its answers on public services, and what public-sector communicators can do about it."
["post_status"]=>
string(7) "publish"
["comment_status"]=>
string(4) "open"
["ping_status"]=>
string(4) "open"
["post_password"]=>
string(0) ""
["post_name"]=>
string(62) "how-do-llms-represent-public-services-to-the-public-they-serve"
["to_ping"]=>
string(0) ""
["pinged"]=>
string(0) ""
["post_modified"]=>
string(19) "2026-11-04 04:47:03"
["post_modified_gmt"]=>
string(19) "2026-11-04 04:47:03"
["post_content_filtered"]=>
string(0) ""
["post_parent"]=>
int(0)
["guid"]=>
string(32) "https://www.isentia.com/?p=50662"
["menu_order"]=>
int(0)
["post_type"]=>
string(4) "post"
["post_mime_type"]=>
string(0) ""
["comment_count"]=>
string(1) "0"
["filter"]=>
string(3) "raw"
}
Blog
How do LLMs represent public services to the public they serve?
Learn how AI cites government organisations, whose sources shape its answers on public services, and what public-sector communicators can do about it.