How Australian broadcast media has shaped the cost of living crisis narrative
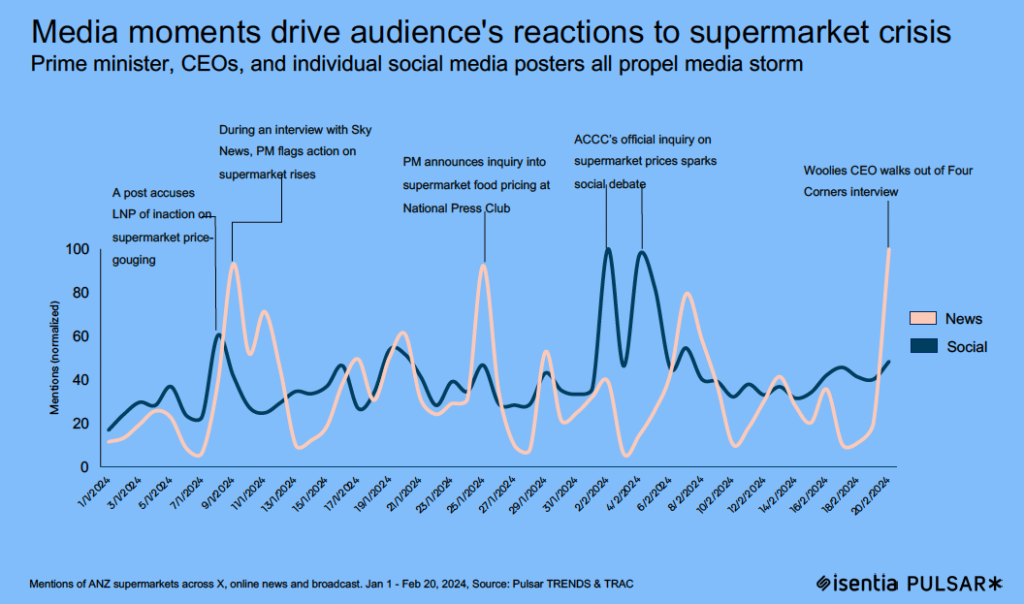
The story around supermarket prices has been evolving for a number of months, finally reaching an inflection point as the Woolworth’s CEO appeared in a challenging interview with Four Corners and then announced his upcoming retirement only two days later.This chain of events underscores the critical importance of understanding the connections made by broadcast media, as they can significantly influence public perceptions and shape the narrative surrounding key industry players.
It was only the latest in a series of media items to seize Australia’s attention, and cast the nation’s supermarkets into something of a PR and Comms crisis.
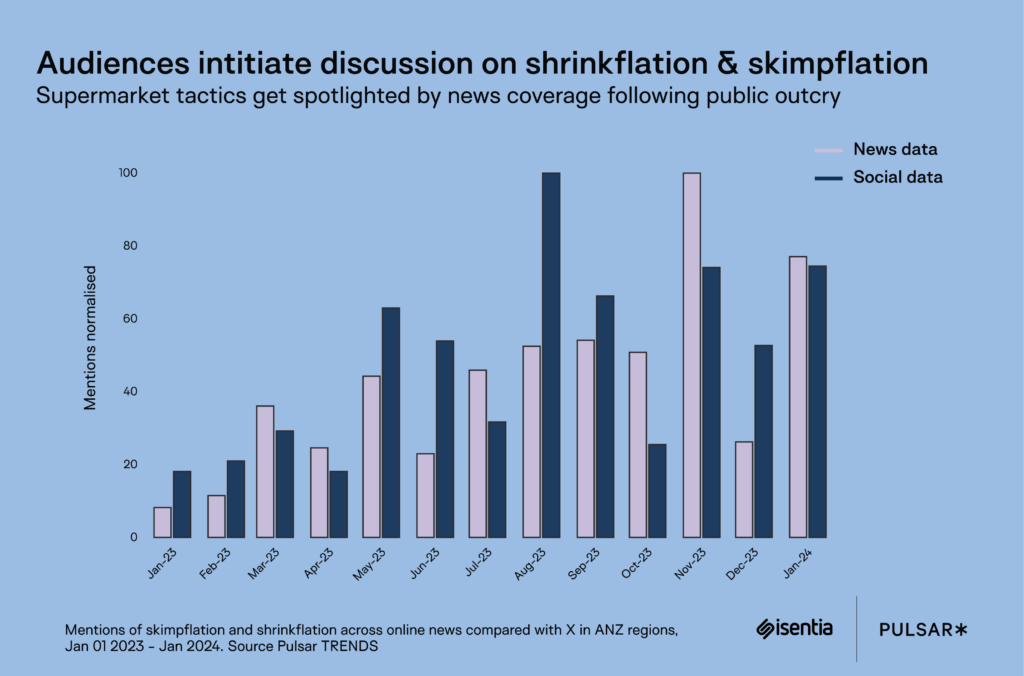
And yet, viewing events through this framing also only gives a partial picture. As the discussion surrounding the impact of supermarkets on the rising cost of living intensifies, we’ve observed a notable surge in the usage of terms such as ‘shrinkflation’ and ‘skimpflation’. Reaching back even further, we can see how the topics attained a gradually greater place on Australian news and social channels. Shrinkflation and skimpflation are tactics employed by supermarkets during economic challenges. Shrinkflation involves reducing product sizes while maintaining prices, subtly passing on costs to consumers. Skimpflation maintains product sizes but compromises on quality to preserve profit margins. These strategies often frustrate supermarket shoppers, especially during economic strains like inflation.
Clearly, the topic has become ubiquitous. But if we want to understand how information and perceptions have been communicated to mainstream Australian audiences, then it becomes vitally important to pay particular attention to broadcast media.
Broadcast media (which includes television, radio and podcasts) plays a pivotal role in shaping public discourse and influencing perceptions, particularly on pressing issues such as the cost of living crisis.
Using Isentia to monitor these data sources, we gain valuable insights into their contribution to consumer attitudes. From identifying which organisations are most associated with the issue to pinpointing key public figures and preferred channels within radio and TV, broadcast media monitoring allows us to understand the complex dynamics that shape public opinion.
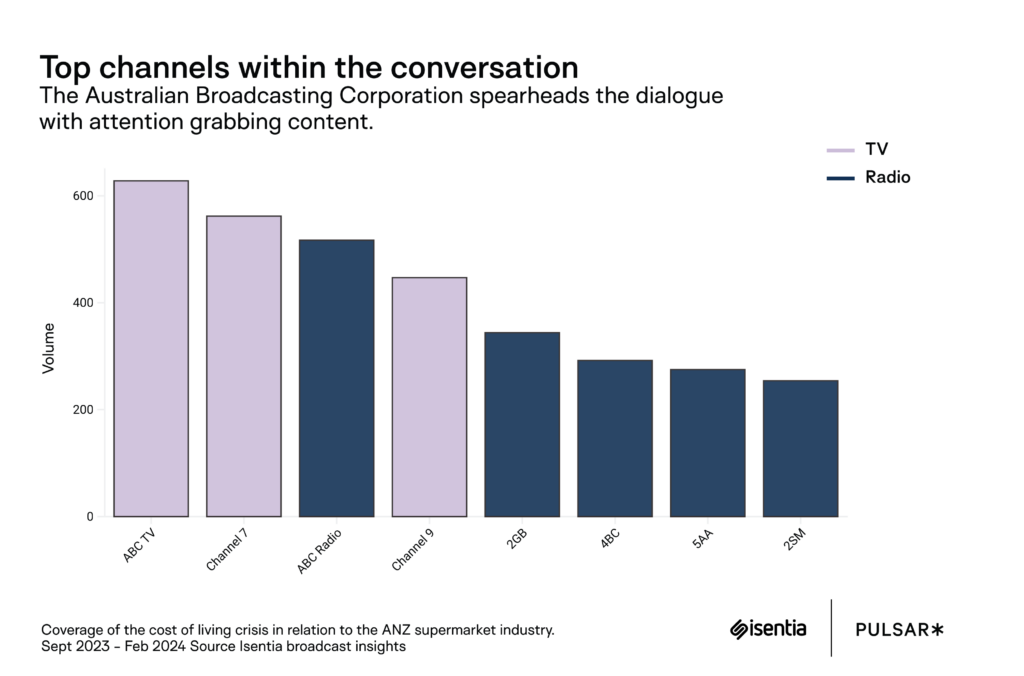
It’s the oldest of these media types which accounts for the most mentions of the supermarket crisis. Beyond reporting updates on the senate inquiry and government actions, radio excels in facilitating in-depth conversations between hosts and listeners, which surfaces more individual consumer stories than television or podcasts can match.
ABC’s predominant coverage of the topic corresponds with the network’s content strategy. Major programs such as the Supermarket Four Corners special and podcasts like The Briefing attract substantial listenership and garner attention from other channels. Channel 7, in addition to delivering key news updates, focuses on the shopper experience within supermarkets, shedding light on everyday challenges faced by audiences, such as navigating shrinkflation and skimpflation tactics.
Understanding the majority share of broadcast channels within this topic is important as it reflects who has the loudest voice, and is most persistently advancing a certain narrative or way of framing the situation.
Coles and Woolworths dominate the conversation, reflecting their prominent presence in the retail landscape. Their widespread accessibility and familiarity to consumers make them prime subjects for discussion in the context of rising costs and economic pressures.
Conversely, Aldi and IGA, while still significant players in the grocery market, may receive comparatively less focus in these discussions. Aldi’s reputation for offering lower-priced alternatives and IGA’s decentralised business model, with independently owned stores, may also contribute to their reduced presence in conversations about supermarket practices during times of economic strain.
Each channel and network approaches discussions about supermarket groups differently. While Coles and Woolworths understandably dominate each station’s broadcasts, the precise balance (and the time afforded to Adi and IGA) is revealing.
For instance, 4BC has encouraged audiences to diversify their shopping habits, with one 4BC broadcaster highlighting that “Aldi and IGA are actually doing more than the other two to really help enormously with the cost of living.”
In the discourse on supermarket practices during the cost of living crisis, a number key figures emerge across broadcast channels. Anthony Albanese, the Australian Prime Minister, is predictably prominent on just about every channel, particularly broadcaster 2SM.
All of them, that is, apart from the Australian Broadcasting Corporation (ABC), which spotlights Allan Fels, an economist and former ACCC chair who has analysed price gouging by major corporations. Other notable politicians mentioned include Treasurer Jim Chalmers, Craig Emerson, Steven Miles, and David Littleproud.
Media’s focus on these figures is crucial for shaping public discourse and policy responses amid economic pressures. While supermarkets are often discussed as a key antagonist in the cost of living crisis, they are increasingly being viewed in the context of potential solutions, particularly regarding government policy to regulate supermarket giants.
At the same time, focus does not only fall on the prominent individuals driving business decisions and policymaking. Country Hour (NSW), for instance, focused a story on cherry grower Michael Cuneo, who ceased selling to supermarkets after he made a financial loss on a shipment of fruit. And it was this story that achieved the greatest media reach of any radio content on the topic.
Clearly then, the topic has not played out in any one way across any one channel. The prominence of key figures and top broadcast channels in this conversation underscores the importance of understanding how media coverage impacts public discourse and regulatory decisions. Isentia’s broadcast capabilities offer unparalleled insight into the role of broadcast media in shaping the narrative surrounding supermarket practices. By harnessing Isentia’s monitoring and analysis tools, organisations can gain deep insights into how influential discourse and coverage can impact an industry.
Loren is an experienced marketing professional who translates data and insights using Isentia solutions into trends and research, bringing clients closer to the benefits of audience intelligence. Loren thrives on introducing the groundbreaking ways in which data and insights can help a brand or organisation, enabling them to exceed their strategic objectives and goals.
While this may make us laugh and may seem like a silly example, it illustrates an important point. People tend to trust what news networks are saying – and this trust doesn’t end with print news. It bleeds into every facet of news, especially televised news.
Here are the five reasons why...
1. Tradition
One of the top reasons people trust TV news networks, especially over newer sources of reporting, is tradition. TV news reporting has been around much longer than internet search and social media, making it more established. When it comes down to it, people are more likely to trust TV news networks because of their confidence in the institution.
2. Loyalty
Another reason for trusting TV news boils down to loyalty. When people have been watching their favourite anchors day-in and day-out for years, they develop a bond of familiarity. With familiarity comes loyalty, and loyalty breeds trust.
3. Communal reinforcement
It’s easy to have confidence in a TV network when the reporting supports your own belief system. In order to maintain trust, news networks tailor their stories to fall in line with the belief systems of their most loyal viewers.
4. Right from wrong
It’s a common theory that news anchors are obliged to shine light into dark places. The only way to accomplish this is by being an advocate of truth.
5. Controversial coverage
News networks also elicit trust from their audience by being the primary source of information about big and controversial stories that the public wouldn’t have much access to otherwise. When a small group of TV news anchors are the only people adequately telling a story, the viewers don’t have many other options for gathering information. As a result, most viewers will trust the story being told.
Whether or not you trust TV news networks over other sources of information, one thing is for certain – TV news networks have a powerful and influential effect on our society.
"
["post_title"]=>
string(15) "TV News Network"
["post_excerpt"]=>
string(184) "Whether we like it or not, news networks play a huge role in how we form opinions. In fact, the news can be so powerful, it can even shape other news networks’ perceptions of truth. "
["post_status"]=>
string(7) "publish"
["comment_status"]=>
string(4) "open"
["ping_status"]=>
string(4) "open"
["post_password"]=>
string(0) ""
["post_name"]=>
string(15) "tv-news-network"
["to_ping"]=>
string(0) ""
["pinged"]=>
string(0) ""
["post_modified"]=>
string(19) "2019-06-25 00:23:16"
["post_modified_gmt"]=>
string(19) "2019-06-25 00:23:16"
["post_content_filtered"]=>
string(0) ""
["post_parent"]=>
int(0)
["guid"]=>
string(36) "https://isentia.wpengine.com/?p=1692"
["menu_order"]=>
int(0)
["post_type"]=>
string(4) "post"
["post_mime_type"]=>
string(0) ""
["comment_count"]=>
string(1) "0"
["filter"]=>
string(3) "raw"
}
Blog
TV News Network
Whether we like it or not, news networks play a huge role in how we form opinions. In fact, the news can be so powerful, it can even shape other news networks’ perceptions of truth.
A weekly tracker tracing the stories, figures and policies driving media and social coverage in the 2026 New Zealand General Election across TV, Radio, Newspaper, Magazine, X, Facebook, Instagram, TikTok, Threads and Forums. This edition covers conversations and coverage from 28th October - 3rd November 2026, highlighting what’s shaping the election conversation.
1. Election Conversation
8,912
total mentions this week
12.2% media87.8% social
Media = news coverage. Social = all public posts across X, Facebook, Instagram, TikTok, Threads and Forums - everyone posting, not just media outlets.
2. Media Issue of the Week
Vote Splitting Divides the Centre-Right in the Final Week
National / ACT / NZ First8.8% of media items · 5.4% of social posts
The argument took off after an RNZ-Reid Research poll put National below a quarter of the party vote. Former National and ACT leader Don Brash then ran advertisements in the Herald telling National supporters to give their party vote to ACT or NZ First instead. The reasoning was that National was expected to win more electorate seats than its party vote entitled it to, so extra party votes for National would not add any MPs. That situation is known as an overhang.
ACT and NZ First both confirmed they had approved the ads, and businessman Harry Mowbray ran a separate "Split Your Vote" website with a similar message. National complained to the Electoral Commission about the website, which was taken down and then put back up with changes. Christopher Luxon criticised his coalition partners' involvement and warned that a party vote for anyone but National risked a Labour-led government. Winston Peters defended splitting the vote as a normal part of how MMP works, and Labour said the row showed division on the right. Te Pāti Māori is taking a similar approach on the left, asking supporters to focus on the electorate vote.
This was one of the biggest political stories of the week. About one in eleven election items in the news covered it in the headline or summary, and many more discussed it further down the article. Coverage started on 29 October and stayed strong through the weekend, with newspaper and TV coverage highest on 2 and 3 November. It matters because it put the voting rules and the relationship between the coalition partners at the centre of the final week, when parties would normally be making their closing policy pitches.
On social media it was a smaller part of the conversation, and the tone was mixed rather than angry. Many posts explained how an overhang works, urged supporters to split their vote or replied directly to Luxon, and the share of negative posts was a little below the weekly average. Because it is about how to vote and not about a policy, it is not linked to a party issue below.
3. What's happening across media and social?
Share of each channel's own conversation, so the two bars are directly comparable
"Social" is all public posts across X, Facebook, Instagram, TikTok, Threads and Forums - not just media organisations' own accounts.
MediaSocial
Issues
Cost of Living
Media
20.5%
Social
23.6%
Economy & Jobs
Media
17.7%
Social
17.4%
Health
Media
11.2%
Social
12.5%
Law & Order
Media
10.6%
Social
11.4%
Parties
National
Media
22.9%
Social
27%
NZ First
Media
17.1%
Social
24.9%
Labour
Media
19.2%
Social
13.6%
ACT
Media
13.1%
Social
14.6%
Greens
Media
13.9%
Social
13.3%
Most frequent presenters and newspapers: The most frequent presenters this week were Dale Husband (Waatea), Sean Plunket (The Platform), Ryan Bridge (Three) and Chris Chang and Tova O'Brien (TVNZ 1). Among newspapers, Otago Daily Times, New Zealand Herald and Daily Post ran the most election coverage.
Widest-reach accounts: Among the accounts that posted most often about the election, those with the widest reach were the New Zealand Herald, RNZ, Chris Lynch Media and the Taxpayers' Union. Parties' and leaders' own accounts are not included.
The issue agenda was very similar in the news and on social media. Cost of living came first, followed by the economy, health and law and order, in the same order on both sides. Cost of living took a somewhat bigger share of social conversation than of news coverage. Law and order has dropped to fourth now that the gang photo row that kept it at the top last week has faded.
The mix of parties differed more. National and NZ First took the biggest shares of social conversation, while National and Labour took the biggest shares of news coverage. NZ First was much more visible on social media, where many posts were about giving a party vote to NZ First or splitting the vote. The Greens had a similar share on both sides.
4. Party Share of Conversation
1. National26.1%
2. NZ First23.1%
3. Labour14.8%
4. ACT14.2%
5. Greens13.5%
6. Opportunity (TOP)4.8%
7. Te Pāti Māori3.5%
Shown for seven parties. Te Pāti Māori and the Opportunity Party (TOP) are included because both featured in the week's polling and vote-splitting coverage. Shares add up to 100% of the seven shown. Share of conversation measures attention, not polling, and is not a sign of electoral success.
5. Top candidates this week
Share of mentions among the five candidates shown
1. Christopher Luxon32.4%
2. Winston Peters23.4%
3. Chris Hipkins15.3%
4. Chloe Swarbrick14.9%
5. David Seymour14.0%
Christopher Luxon led the field, mainly because of the vote-splitting row and the poll showing National under pressure. He criticised ACT and NZ First for their part in the ads, brought in former prime minister John Key to campaign for the party, and said the finance portfolio would stay with National.
Winston Peters came second, with a slightly bigger share of social conversation than of news, after defending vote splitting. Chris Hipkins was more prominent in the news than on social media, helped by Labour's manifesto launch and his comments on the divisions on the right.
Chloe Swarbrick featured for the Greens' wealth tax and for her response to National's attack advertisements. David Seymour featured for ACT's part in the vote-splitting ads, the contest in Epsom and speculation about whether he could become finance minister. Mentions measure how much someone is being talked about, not how they are polling.
6. Election Issues
Top 4 themes this week
Share of mentions among the four themes shown
Cost of Living35.5%
Economy & Jobs27.9%
Health19.0%
Law & Order17.6%
What's driving conversation about each party?
Each party's top issues this week in social conversation, ranked by how much they were discussed
National
1Taxes
2Economy
3Cost of living
Labour
1Cost of living
2Economy
3Wealth tax
Greens
1Economy
2Wealth tax
ACT
1Tax
2Freedom
Issues are ranked from social posts. Counts are not shown because the numbers for a single party and issue are small.
7. Issues to Watch
The vote-splitting argument is likely to continue until election day. National is still asking supporters to give both votes to National, while ACT and NZ First have defended their position. How much it affects party votes may only be clear once the results come in, and it could then shape the talk about overhang seats and coalition negotiations.
Changes to the enrolment rules are another live issue. People can no longer enrol once early voting has opened. There are questions about how many people who are not enrolled will turn up to vote and how many special votes will need to be counted. Those questions are likely to return when the results are announced.
Questions about who would run the economy are likely to grow as coalition talks come into view. Luxon has said the finance portfolio stays with National, while there has been plenty of speculation about whether Seymour could take the role. Cost of living is the biggest issue in both the news and on social media, so promises on tax and spending are likely to stay in the conversation.
If you want to find out more about how Isentia can help you understand the NZ media landscape, please reach out to us here.
"
["post_title"]=>
string(75) "NZ Election 2026: Vote Splitting Row, NZ First Surges, Cost of Living Leads"
["post_excerpt"]=>
string(149) "NZ election vote splitting divided the centre-right in the final week. We tracked 8,912 media and social mentions to see what drove the conversation."
["post_status"]=>
string(7) "publish"
["comment_status"]=>
string(4) "open"
["ping_status"]=>
string(4) "open"
["post_password"]=>
string(0) ""
["post_name"]=>
string(40) "nz-election-vote-splitting-media-tracker"
["to_ping"]=>
string(0) ""
["pinged"]=>
string(0) ""
["post_modified"]=>
string(19) "2026-11-04 13:07:56"
["post_modified_gmt"]=>
string(19) "2026-11-04 13:07:56"
["post_content_filtered"]=>
string(0) ""
["post_parent"]=>
int(0)
["guid"]=>
string(32) "https://www.isentia.com/?p=50915"
["menu_order"]=>
int(0)
["post_type"]=>
string(4) "post"
["post_mime_type"]=>
string(0) ""
["comment_count"]=>
string(1) "0"
["filter"]=>
string(3) "raw"
}
Blog
NZ Election 2026: Vote Splitting Row, NZ First Surges, Cost of Living Leads
NZ election vote splitting divided the centre-right in the final week. We tracked 8,912 media and social mentions to see what drove the conversation.
How do I navigate aged care in Australia? How easy are government services to deal with? How well supported are people with disabilities? These are big questions about life in Australia, and many people now put them to an AI tool before they visit a website, pick up the phone or speak to anyone. They rarely mention a government agency by name, yet the answer they get still shapes what they believe about the services behind it: whether the system works, who is responsible and whose information they can trust. That is reputation taking shape, in a conversation no communications team is part of.
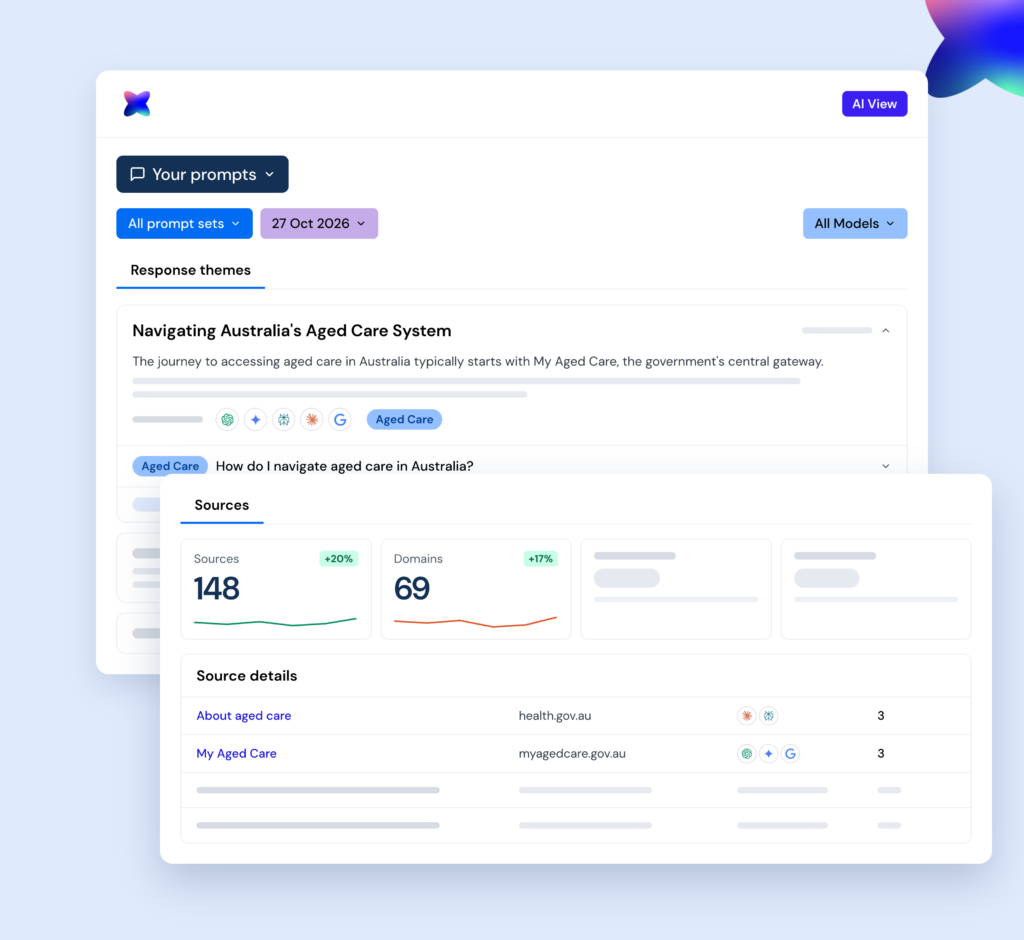
To see how that plays out, we used Your Prompts, a new feature in Isentia's AI View, to track how leading AI models answer these questions. Here's what we found, whose information the models used, how each model goes about sourcing its answers, and what it all means for public-sector communicators.
Starting with the question
Most AI visibility tracking starts with an organisation's name. Your Prompts lets you set your own questions, which gives public-sector teams a much wider view of their reputation. People rarely ask an AI tool about an agency by name; they ask for help with whatever problem is in front of them, whether that's getting a parent into aged care or working out what support is available for a carer. Or they ask something bigger, such as how well the country looks after older people.
We tracked six sets of questions across leading AI models, covering the things people deal with at different stages of life: finding their way around government services, getting older, living with disability and caring for someone, raising a family, staying healthy, and making ends meet. For this article we focused on three of them: access and navigation, aged care, and disability and carers. These are the moments when people depend most directly on the government, which means a wrong or incomplete answer can have real consequences for someone trying to get help, and can colour how they feel about the system as a whole.
We compared answers from ChatGPT, Claude, Gemini, Perplexity and Google AI Overview, looking at what each model said, which sources it cited and which organisations it named. The questions were set up for tracking rather than drawn from a survey of what the public actually asks, and the findings reflect a single point in time, using the latest data from 27 October 2026. Even so, the patterns in how AI finds and presents information about public services were clear and consistent.
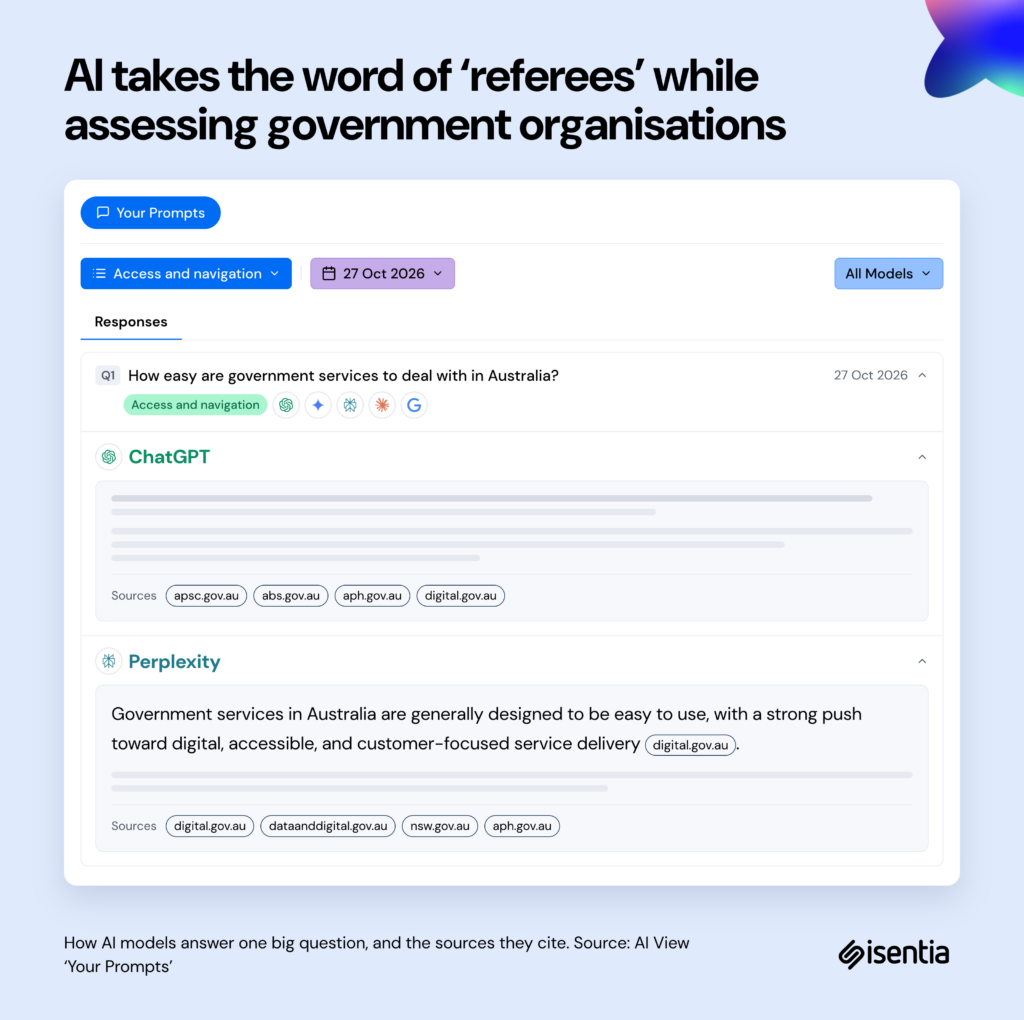
How easy are government services to deal with in Australia?
We asked this alongside a second question: how well government support reaches the people who need it. Most models landed on a similar view: digital services work well for simple tasks, while complex cases, phone contact and people in vulnerable situations are where things get harder. The more interesting part is where that view comes from. The models formed it largely through oversight bodies, with the national audit office's findings carrying particular weight.
Government's own voice only came through when a model cited official pages, as when one model described digital services as a major strength, using a government website as the source. In other words, when AI assesses how the government is performing, it largely takes the word of the ‘referees’. Owned content can earn you a line in the answer, but auditors, commissions and advocates write most of the scorecard. For reputation, that gives an audit finding a second life. Well after the news cycle moves on, it can still be part of the answer people get when they ask how the government is doing. That brings us back to a question we raised in our article on AI visibility for government agencies: is your organisation still seen as the main authority on its own services?
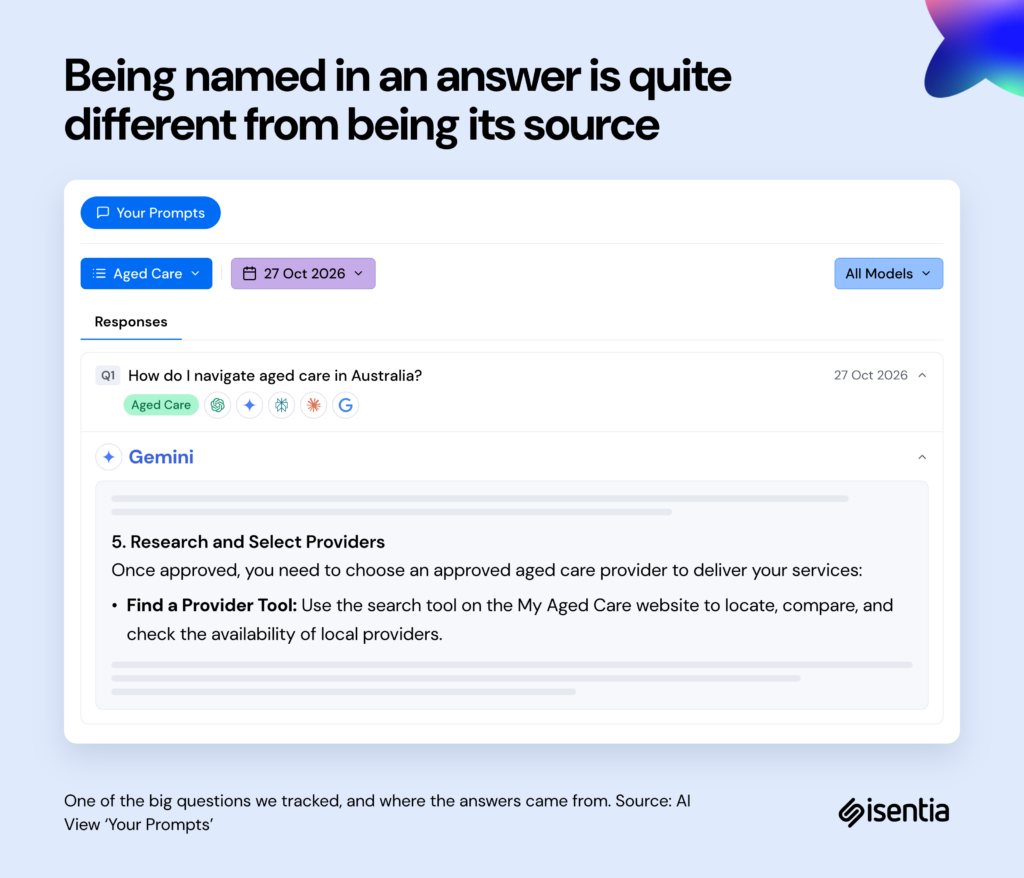
How do I navigate aged care in Australia?
Almost every model named government services as the place to go for financial assessments, payments and in-person help, and the tone was neutral to positive. One model went as far as recommending that people complete a means assessment early so they don't end up paying more than they need to.
The catch is that the agencies people were being sent to were rarely the source of that information, which mostly came from other government portals and guides written by aged care providers and advocacy groups. In one answer, even an agency's own contact details were taken from a seniors' advocacy group's website. Being named in an answer, then, is quite different from being its source. It builds recognition, but someone else is setting people's expectations of what they'll find when they get there, and if that guide is out of date, it's the service they feel let down by.
Zoom out to the bigger question of how well Australia looks after older people, and the agencies that were the first port of call in the practical answers didn't appear at all. These answers were framed by the Royal Commission into Aged Care Quality and Safety, which concluded in 2021, with most models opening on its findings and some giving them more weight than the reforms that followed. This is the reputational point that's easiest to miss: the practical question tells people where to go, while the big question tells them what kind of system they're dealing with. As we covered in why content freshness matters for AI visibility, old stories have a habit of shaping AI answers long after the facts have moved on.
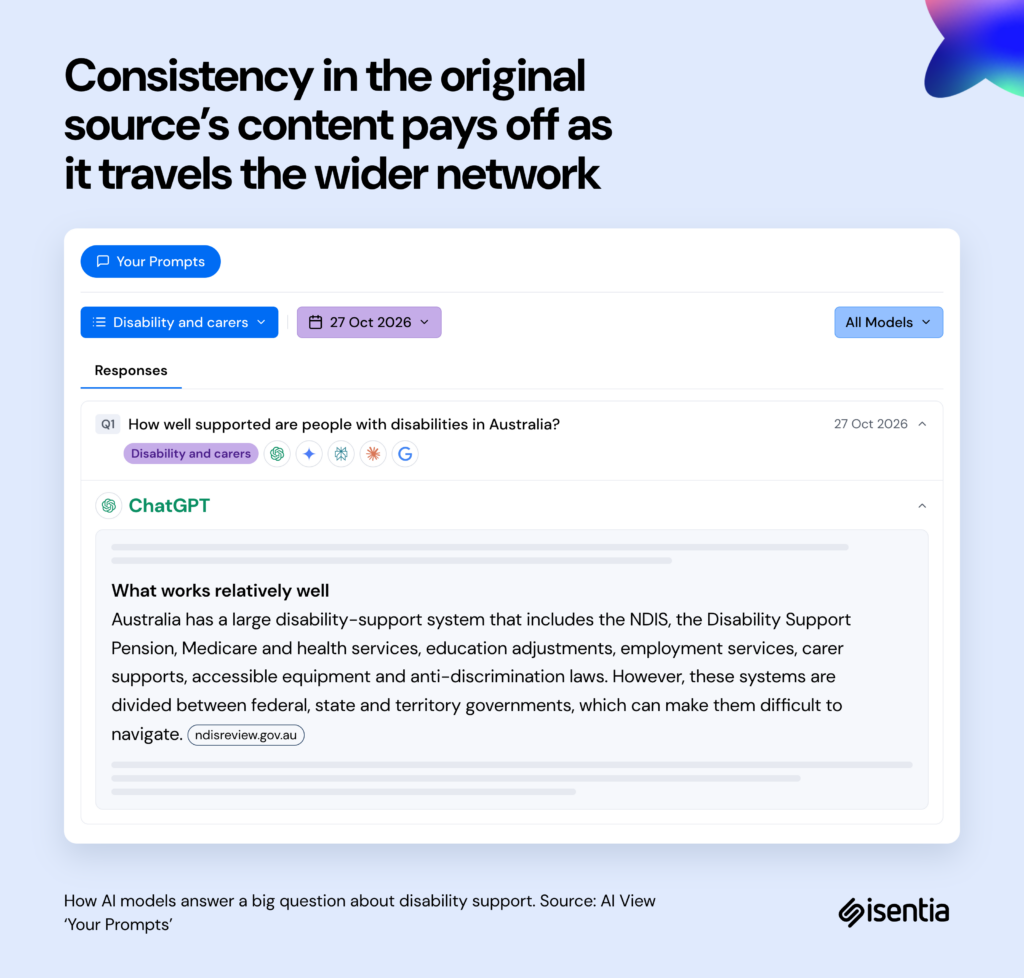
How well supported are people with disabilities in Australia?
The models discussed income support payments without naming the agency that delivers them, focusing instead on the NDIS and the gaps in support. That said, not every absence is a problem. Some questions genuinely aren't about a particular organisation, so it makes sense for it to sit them out. The useful distinction for communicators is between a relevant absence, where the question simply isn't about you, and a missed opportunity, where your work is being discussed and you aren't getting the credit. Repeated across enough answers, a missed opportunity leaves people with a picture of support that doesn't include the people delivering it.
Questions about caring for someone played out differently. Every model gave almost the same answer and pointed people to the same national carer support service. When official information is clear and consistent across agencies, peak bodies and support services, AI repeats it faithfully. There was one notable exception, where a model explained the government's carer payments using a blog from a private company that sells personal medical alarms. The information was mostly accurate, but it shows how far an explanation can travel from its original source. The good news is that consistency across your wider network really does pay off: when the organisations around you describe your services the way you do, AI is more likely to get them right, and that shared story becomes part of your reputation.
Why each model tells the story differently
Across all three categories, each model showed clear habits in the sources it reached for. We can see what each one cites, even if we can't see exactly how it decides, and the patterns are consistent enough to act on. In practice, your reputation can look different depending on the tool someone uses. These habits also build on what we found when we looked at how different LLMs represent your organisation.
Model
Where it gets its information
Example from our research
What it means for communicators
ChatGPT
Official statistics, audit reports and formal reviews. It pairs almost every claim with a figure or finding, much like a policy analyst writing a briefing note.
When asked whether government support reaches people in need, it built its answer around the national audit office’s findings. It was also the model most likely to cite the website of the agency delivering a service.
Oversight reports shape how ChatGPT judges your performance, while your own pages shape how it describes what you do.
Claude
The widest mix of sources, including advocacy groups, provider guides and commentary alongside government material. It tends to explain the reasons behind an issue and present more than one side.
When describing the Royal Commission’s “national disgrace” finding, it relied mostly on second-hand accounts of the report, such as Wikipedia and a private aged care provider’s website.
The organisations that retell your story effectively become your spokespeople.
Gemini
University research and international bodies such as the OECD, drawn from Google’s broad index of academic platforms, video and international sources.
On aged care, it drew on an overseas policy institute’s summary of Australia’s new aged care legislation.
Published research and evaluations carry real weight, as do secondary sources describing your work, wherever in the world they are published.
Perplexity
The most recently updated pages, quoted closely. It is built around live search with visible citations, so it favours recent, easy-to-access pages.
On access to services, it quoted a government corporate plan published only weeks earlier.
This is where keeping your own content current pays off fastest.
Google AI Overview
A small number of sources, summarised briefly, because it is designed to give a quick answer at the top of search results.
On disability support, it relied mainly on the scheme’s own website and summarised criticism in general terms, without naming who made it.
The few sources it chooses carry a lot of weight, so clear, well-structured official pages give you the best chance of being one of them.
One question, several versions
Put together, the same question can produce an audit-style answer, an advocacy-informed analysis, a research summary or a current snapshot, depending on which tool someone happens to open. Two people asking the same question can come away with quite different impressions of the same service. There's no single AI view of an organisation to manage, because each model has its own sources and each needs a slightly different approach.
Zooming out: how these answers add up to reputation
Look at any one of these answers and it can seem like a visibility issue. Put them together and it's a reputation issue. For public-sector organisations, reputation has always been about more than what's said about you by name. It rests on whether people believe the system works, know where to turn and trust what they're told, and those impressions are now forming in AI answers, one question at a time.
Across these questions, four things shaped the impression an answer left:
Who gets named. Whether you appear when your work is being discussed, and get the credit for it.
Who does the explaining. Whether people hear how your services work from you, or from a provider, an advocate or a company blog.
Who acts as referee. Whose assessment of your performance gets repeated as the verdict.
Which story sets the frame. Whether the answer opens on where things stand today, or on a finding from years ago.
None of this shows up if you only ask AI about your organisation by name. You see it when you ask the questions your audience is asking. And it matters, because AI is now one of the main places where people go for information about the things that matter to them.
What this means for public-sector communicators
Government organisations can't control what AI says, but they can do a lot to influence the information it draws on, and with it the reputation that forms around them. Five practical steps came out of this research.
Track the big questions, not just your name. The most useful insights came from questions about services and real-life situations rather than about any one organisation, so start with what your audience is trying to do or understand, and check what AI is telling them.
Work with the bodies that assess your performance. Auditors, commissions and advocates shape how AI judges your work, so respond to their findings publicly and make sure your progress is recorded in the sources they, and AI, rely on. That way an old finding doesn't have to stand alone.
Support the organisations that explain your services. Sister agencies, peak bodies, providers and advocacy groups often explain your services for you, so give them clear, current information to work from. As we found in our analysis of Tier 1 and Tier 2 media in AI answers, specialist and niche sources often matter more to AI than their profile suggests.
Keep practical information clear and up to date. Plain-language pages on eligibility, processes and how to get help are what AI repeats when people ask how to do something. Organisations that deliver services directly rely on this more than most, because outdated information can lead someone to miss out on support they're entitled to.
Check answers across several models regularly. Each model uses different sources, so one model's answer is a poor guide to the others, and because answers shift as new content is published, regular tracking shows whether your updates are reaching the sources AI uses.
Whose information is AI using?
AI is already answering big questions about life in Australia, whether or not the public-sector organisations involved are part of the conversation. This research shows that an organisation can be mentioned often and still have surprisingly little say in how its services are described or how its performance is judged, with other organisations doing much of the explaining and each AI model weighing those voices differently.
For communicators, the job is to understand that wider network of sources and make sure accurate, current information runs through all of it. It's worth asking what AI says about your organisation. It's just as worthwhile asking what AI says when nobody mentions you, and whose information it's using to say it. That's where much of your reputation is now taking shape.
Want to see what AI tells people about the questions that matter to your audience? Get in touch about AI View.
"
["post_title"]=>
string(63) "How do LLMs represent public services to the public they serve?"
["post_excerpt"]=>
string(150) "Learn how AI cites government organisations, whose sources shape its answers on public services, and what public-sector communicators can do about it."
["post_status"]=>
string(7) "publish"
["comment_status"]=>
string(4) "open"
["ping_status"]=>
string(4) "open"
["post_password"]=>
string(0) ""
["post_name"]=>
string(62) "how-do-llms-represent-public-services-to-the-public-they-serve"
["to_ping"]=>
string(0) ""
["pinged"]=>
string(0) ""
["post_modified"]=>
string(19) "2026-11-04 04:47:03"
["post_modified_gmt"]=>
string(19) "2026-11-04 04:47:03"
["post_content_filtered"]=>
string(0) ""
["post_parent"]=>
int(0)
["guid"]=>
string(32) "https://www.isentia.com/?p=50662"
["menu_order"]=>
int(0)
["post_type"]=>
string(4) "post"
["post_mime_type"]=>
string(0) ""
["comment_count"]=>
string(1) "0"
["filter"]=>
string(3) "raw"
}
Blog
How do LLMs represent public services to the public they serve?
Learn how AI cites government organisations, whose sources shape its answers on public services, and what public-sector communicators can do about it.