Blog
5 reasons why a headline goes viral
A headline might be a reader’s first – and only – contact with a brand, and many will keep skimming until they land on something that takes their interest.
The Internet is saturated with content.
Content creators should strive to drive virality to emerge from the flood of online content. Viral content is not merely a popular piece, but it garners excessive engagement to outliers.
This paper explores some common factors of viral content.
If you would like more information about monitoring your content, get in touch with us today.

Loren is an experienced marketing professional who translates data and insights using Isentia solutions into trends and research, bringing clients closer to the benefits of audience intelligence. Loren thrives on introducing the groundbreaking ways in which data and insights can help a brand or organisation, enabling them to exceed their strategic objectives and goals.
A headline might be a reader's first – and only – contact with a brand, and many will keep skimming until they land on something that takes their interest.
If you aren't into the nitty-gritty of headlines, stop reading now. But if you want to be that content creator who writes the runaway headline, here's a snapshot of what some of the research has found.
Between 1 March and 10 May 2017, BuzzSumo analysed 100 million of the most shared article headlines on Facebook and Twitter, the platforms dominated by publisher and consumer content. Then in July, it published its analysis of 10 million B2B headlines – those shared on LinkedIn – and found that the best headline phrases, structures, numbers and lengths differed from the B2C results.
While previous research suggested that the first three and last three words were the important parts of a headline, the BuzzSumo research highlighted linking phrases as key for headlines targeting B2C audiences.
The three-word phrase – or trigram – that led the engagement charge (likes, shares, comments) was 'will make you'. In fact, on Facebook it had twice as many engagements as the trigram that took second place ('this is why'), followed by 'can we guess', 'only X in' and 'the reason is'.
BuzzSumo determined that the success of the 'will make you' phrase was based on it linking content to the emotional impact it will have on the reader – it sets you up to care ('will make you cry', 'will make you smarter', etc.).
It also found that headlines that provoke curiosity work well when readers are looking to learn something from an article. They are a little like the 'will make you' articles, but they tell you what you'll find out rather than what you'll feel.
The BuzzSumo research found that the top five phrases starting a B2C headline were:
The top five phrases ending a B2C headline were:
Admittedly, the second-place holder might not rate as well in Australia, but the five top-performing first words were:
So, what doesn't work for B2C audiences? The five worst-performing frequently used phrases were:
Confirming earlier Outbrain research, BuzzSumo found that 12 to 18 words and 80 to 95 characters had the highest engagement on Facebook.
In BuzzSumo's analysis of 10 million headlines of articles shared on LinkedIn, the practical and informative nature of how-to and list posts (see #3 below) proved to be strong performers in the top five most popular three-word phrases:
There was a clear frontrunner in the top two-word phrases starting headlines – 'How to…' was shared almost three times more on average than the second-place holder. The top two-word phrases starting B2B headings were:
Note that after the 'How to…' phrase, the next four most shared phrases were all forms of list posts, which gained more than double the average shares of ‘what’ or ‘why’ posts.
Celebrity brand names also garnered high levels of engagement. It makes sense that companies influencing the business environment and forging technological and business model innovation – like Uber, Google, Apple, Facebook, Tesla and Amazon – will have strong reader appeal. For example, nib's Ambulance or Uber: Who you gonna call?generated a lot of conversation on its Facebook page due to Uber's topicality.
At seven to 12 words, the optimum headline length for LinkedIn is much shorter than for Facebook.
In July 2017, CoSchedule founder Garrett Moon published results of an analysis that began with close to one million blog headlines – which were then put through various filters. The top takeaway was that list posts or listicles (headlines that start with a number) are "huge". Moon wrote they are "the most likely type of post to be shared 1000 or even 100 times". Interestingly, he also noted that "list posts only made up 5% of the total posts actually written".
The BuzzSumo research, confirming the power of lists and the list post format, found the six most effective numbers (in descending order) in B2C content are 10, 5, 15, 7, 20 and 6. In B2B content, the most shared numbers that start post headlines are 5, 10, 3, 7, 4 and 6, with 5 and 10 performing equally well. Note that how-to posts outstripped list posts in B2B.
CoSchedule's results show that list posts that they identified by the words 'thing', 'should' and 'reasons' – '5 things you can do…', '4 reasons why you should…' – do best on Facebook, Twitter and LinkedIn.
It's possible that this is due to a combination of clear promise (‘10 steps’, etc.) and the scannable nature of the post, where you can easily work out which bits you want to read.
While strong emotional headlines and those provoking curiosity may get you results, you need to rein in any urge to overstate.
In May 2017, Facebook announced it would demote “headlines that exaggerate the details of a story with sensational language” and those that aim “to make the story seem like a bigger deal than it really is.”
There may be some debate about what is and isn't clickbait, but there are two key points to consider. In the first place, the reader needs to feel encouraged to read. And in the second, they need to not be disappointed when they have finished reading.
There are no hard and fast rules. You always need to research what works for your audience, your topics and your social platforms, and to test your headlines. Different audiences will require different content and will be accessing it on different platforms. For example, Outbrain works for an editorial-led audience more than a business-specific audience.
In the interests of transparency, this headline isn't the first that came to mind. It's the result of trawling through this research.
Maybe we all need to take the advice of Ann Handley, chief content officer at MarketingProfs: "Spend as much time writing the headline as you do an entire blog post or social post."
Belinda Henwood, Strategy & Content
" ["post_title"]=> string(35) "5 reasons why a headline goes viral" ["post_excerpt"]=> string(159) "A headline might be a reader's first – and only – contact with a brand, and many will keep skimming until they land on something that takes their interest." ["post_status"]=> string(7) "publish" ["comment_status"]=> string(4) "open" ["ping_status"]=> string(4) "open" ["post_password"]=> string(0) "" ["post_name"]=> string(35) "5-reasons-why-a-headline-goes-viral" ["to_ping"]=> string(0) "" ["pinged"]=> string(0) "" ["post_modified"]=> string(19) "2019-06-26 00:53:19" ["post_modified_gmt"]=> string(19) "2019-06-26 00:53:19" ["post_content_filtered"]=> string(0) "" ["post_parent"]=> int(0) ["guid"]=> string(43) "https://isentiastaging.wpengine.com/?p=1842" ["menu_order"]=> int(0) ["post_type"]=> string(4) "post" ["post_mime_type"]=> string(0) "" ["comment_count"]=> string(1) "0" ["filter"]=> string(3) "raw" }A headline might be a reader’s first – and only – contact with a brand, and many will keep skimming until they land on something that takes their interest.
Is content marketing an art or a science?
It’s not a new debate but an increasingly relevant one. As technology continues to improve, the C-Suite is demanding a clearer measurement into impact. Marketing and communications professionals responsible for curating content are no longer governed by ‘gut feeling’ and instead, are increasingly driven by engagement metrics to demonstrate ROI.
These professionals are well aware how their role requires a mix of art and science thinking. They both draw from the left brain and the right brain, using data and reason to guide the creativity that fuels it.
But this relationship is less rigorously applied to content marketing – an emerging discipline that straddles both marketing and communications objectives.
Marketers and communications professionals have varying levels of social media sophistication – particularly with LinkedIn, which is often a core channel for content. With LinkedIn estimating more than 130, 000 posts are made on its newsfeed every week, organisations are increasingly turning to it as a distribution channel for thought leadership.
Far fewer, however, understand how to draw insight from the platform to ensure their content connects with their target audience.
Marketers and communications practitioners will often speak to me with this challenge solely in mind. Most are able to gauge the success of content on Facebook and Instagram to some level. Plenty of tools exist which measure various social aspects of content marketing, such as ‘likes’ or ‘shares’. But real engagement isn’t buzz. Determining whether content is connecting with a target audience is a key challenge.
Content marketers are struggling to understand whether their current LinkedIn strategy is working – whether it’s reaching the right audience and whether a piece of content is being actively engaged on the platform.
Other times, they will want to target a particular demographic; millennials for example. But they don’t have the understanding of what this group is looking for when they log onto this social networking site.
In short, what content marketers want to do is debunk the myths surrounding their own activity and drill down into strategy to make their dollars work harder.
Data is pivotal. Armed with information, marketers and communications professionals have a window into the opinions, passions and motivations of their audience.
At Isentia we’ve seen this in our own business. The Research & Insights stream has grown by 25 per cent in the last year, as this market recognises the importance of data. I’m often told by clients that they’re just at the start of their measurement journey, but still desperately rely on data to convince the C-Suite to spend money on content marketing.
Research & Insights can be used to help inform content marketing strategy by highlighting what brand-relevant topics an organisation’s audience is engaging with. It can also help content marketers understand where their brand sits against those their competitors, by measuring their share of voice on a particular topic.
But most importantly, data can help marketing and communications practitioners build out content itself. By understanding what type of content receives the most engagement on the platform, they can tailor their content strategies and measure their success at the same time.
Data is the key to debunking the myths of what does or doesn’t work in a content marketing strategy. It gives marketers and communications professionals the opportunity to ensure they understand their audience first and foremost, in order to communicate in a way that connects.
This is where science can help inform the art in content marketing.
Asha Oberoi
Head of Insights, Australia
Video content continues to rise in popularity. We have explored how marketers can connect with their video audience and drive strong engagements.
Download our whitepaper to learn more.
" ["post_title"]=> string(53) "A marketer’s guide to connect with a video audience" ["post_excerpt"]=> string(97) "Find out the importance of video content in 2019 and how you can connect with your video audience" ["post_status"]=> string(7) "publish" ["comment_status"]=> string(4) "open" ["ping_status"]=> string(4) "open" ["post_password"]=> string(0) "" ["post_name"]=> string(50) "a-marketers-guide-to-connect-with-a-video-audience" ["to_ping"]=> string(0) "" ["pinged"]=> string(0) "" ["post_modified"]=> string(19) "2023-07-07 02:41:43" ["post_modified_gmt"]=> string(19) "2023-07-07 02:41:43" ["post_content_filtered"]=> string(0) "" ["post_parent"]=> int(0) ["guid"]=> string(35) "https://isentia.wpengine.com/?p=935" ["menu_order"]=> int(0) ["post_type"]=> string(4) "post" ["post_mime_type"]=> string(0) "" ["comment_count"]=> string(1) "0" ["filter"]=> string(3) "raw" }Find out the importance of video content in 2019 and how you can connect with your video audience
How do I navigate aged care in Australia? How easy are government services to deal with? How well supported are people with disabilities? These are big questions about life in Australia, and many people now put them to an AI tool before they visit a website, pick up the phone or speak to anyone. They rarely mention a government agency by name, yet the answer they get still shapes what they believe about the services behind it: whether the system works, who is responsible and whose information they can trust. That is reputation taking shape, in a conversation no communications team is part of.
To see how that plays out, we used Your Prompts, a new feature in Isentia's AI View, to track how leading AI models answer these questions. Here's what we found, whose information the models used, how each model goes about sourcing its answers, and what it all means for public-sector communicators.
Most AI visibility tracking starts with an organisation's name. Your Prompts lets you set your own questions, which gives public-sector teams a much wider view of their reputation. People rarely ask an AI tool about an agency by name; they ask for help with whatever problem is in front of them, whether that's getting a parent into aged care or working out what support is available for a carer. Or they ask something bigger, such as how well the country looks after older people.
We tracked six sets of questions across leading AI models, covering the things people deal with at different stages of life: finding their way around government services, getting older, living with disability and caring for someone, raising a family, staying healthy, and making ends meet. For this article we focused on three of them: access and navigation, aged care, and disability and carers. These are the moments when people depend most directly on the government, which means a wrong or incomplete answer can have real consequences for someone trying to get help, and can colour how they feel about the system as a whole.
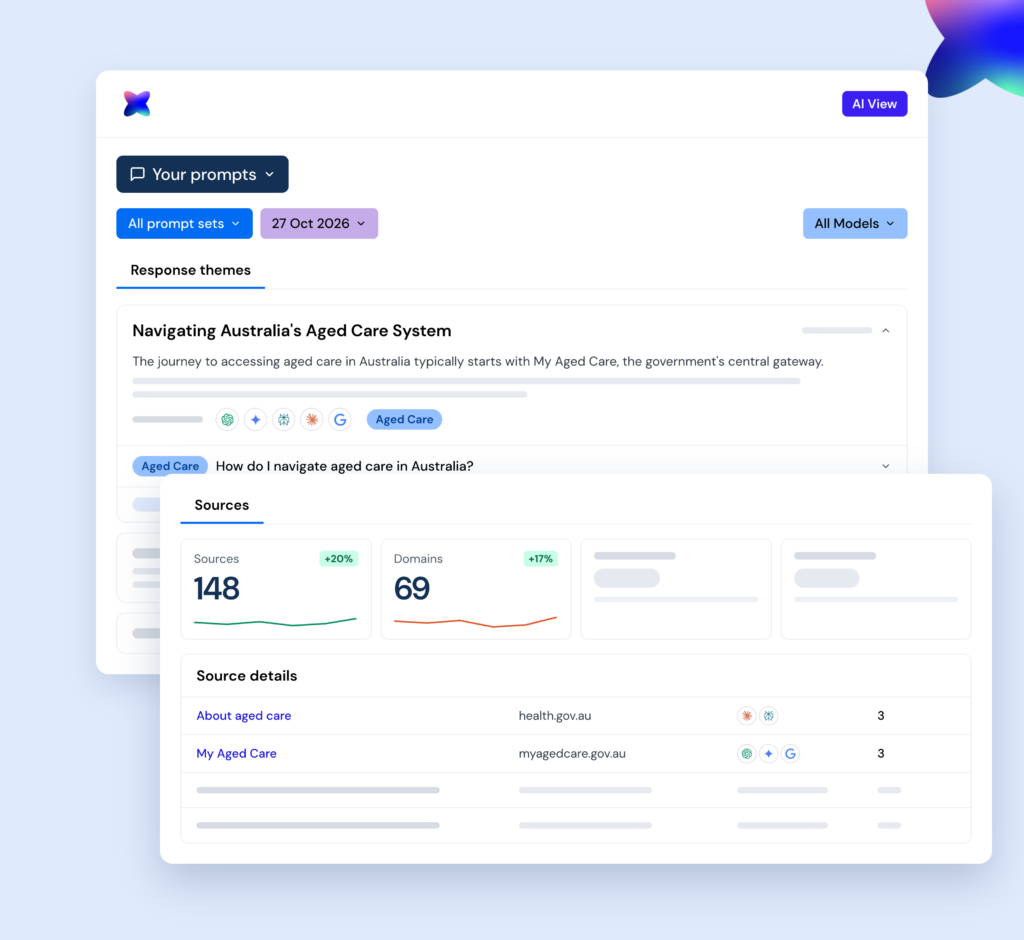
We compared answers from ChatGPT, Claude, Gemini, Perplexity and Google AI Overview, looking at what each model said, which sources it cited and which organisations it named. The questions were set up for tracking rather than drawn from a survey of what the public actually asks, and the findings reflect a single point in time, using the latest data from 27 October 2026. Even so, the patterns in how AI finds and presents information about public services were clear and consistent.
We asked this alongside a second question: how well government support reaches the people who need it. Most models landed on a similar view: digital services work well for simple tasks, while complex cases, phone contact and people in vulnerable situations are where things get harder. The more interesting part is where that view comes from. The models formed it largely through oversight bodies, with the national audit office's findings carrying particular weight.
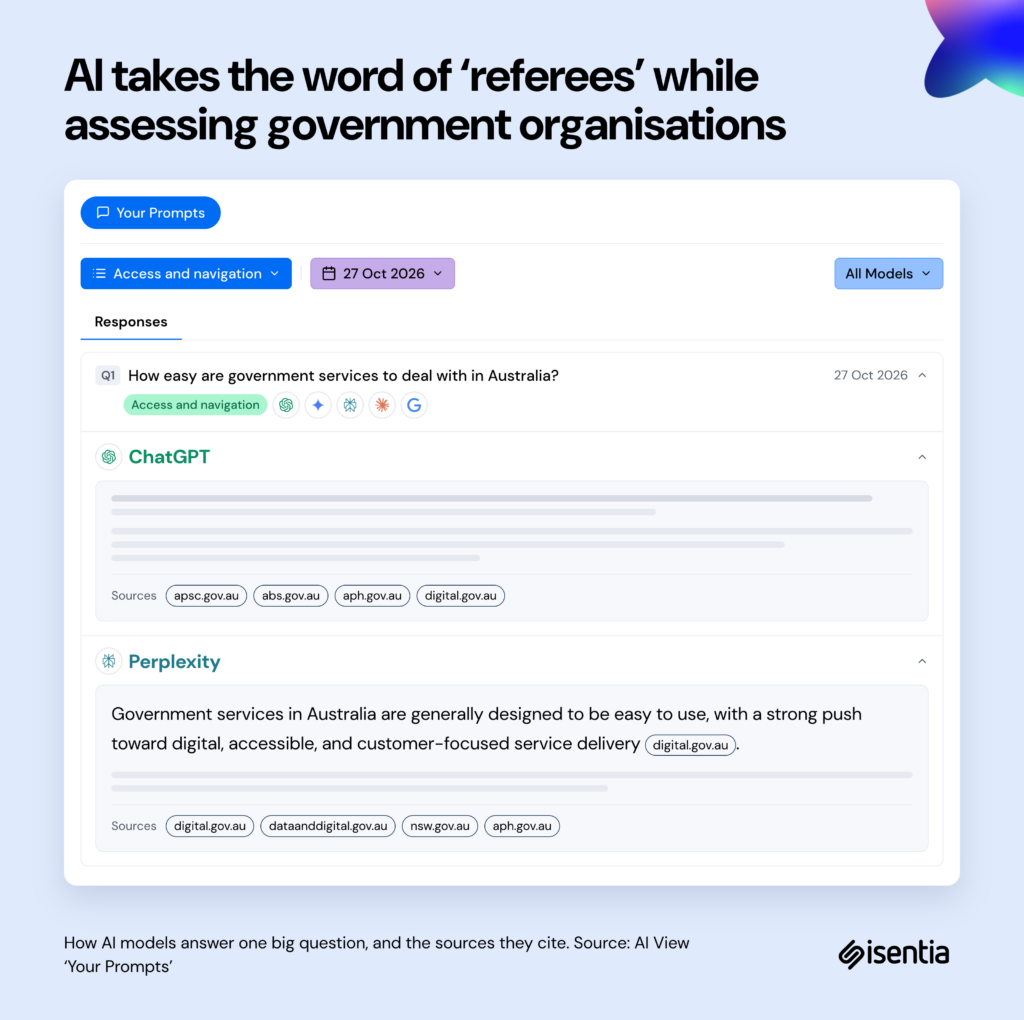
Government's own voice only came through when a model cited official pages, as when one model described digital services as a major strength, using a government website as the source. In other words, when AI assesses how the government is performing, it largely takes the word of the ‘referees’. Owned content can earn you a line in the answer, but auditors, commissions and advocates write most of the scorecard. For reputation, that gives an audit finding a second life. Well after the news cycle moves on, it can still be part of the answer people get when they ask how the government is doing. That brings us back to a question we raised in our article on AI visibility for government agencies: is your organisation still seen as the main authority on its own services?
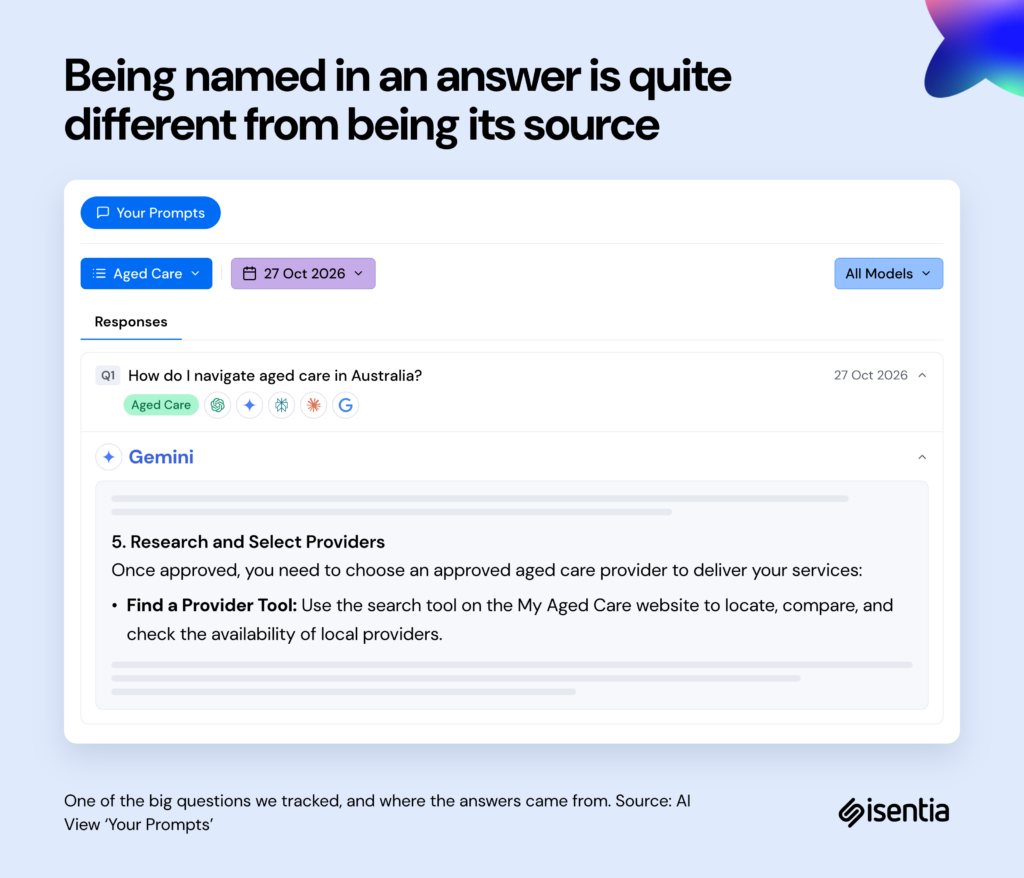
Almost every model named government services as the place to go for financial assessments, payments and in-person help, and the tone was neutral to positive. One model went as far as recommending that people complete a means assessment early so they don't end up paying more than they need to.
The catch is that the agencies people were being sent to were rarely the source of that information, which mostly came from other government portals and guides written by aged care providers and advocacy groups. In one answer, even an agency's own contact details were taken from a seniors' advocacy group's website. Being named in an answer, then, is quite different from being its source. It builds recognition, but someone else is setting people's expectations of what they'll find when they get there, and if that guide is out of date, it's the service they feel let down by.
Zoom out to the bigger question of how well Australia looks after older people, and the agencies that were the first port of call in the practical answers didn't appear at all. These answers were framed by the Royal Commission into Aged Care Quality and Safety, which concluded in 2021, with most models opening on its findings and some giving them more weight than the reforms that followed. This is the reputational point that's easiest to miss: the practical question tells people where to go, while the big question tells them what kind of system they're dealing with. As we covered in why content freshness matters for AI visibility, old stories have a habit of shaping AI answers long after the facts have moved on.
The models discussed income support payments without naming the agency that delivers them, focusing instead on the NDIS and the gaps in support. That said, not every absence is a problem. Some questions genuinely aren't about a particular organisation, so it makes sense for it to sit them out. The useful distinction for communicators is between a relevant absence, where the question simply isn't about you, and a missed opportunity, where your work is being discussed and you aren't getting the credit. Repeated across enough answers, a missed opportunity leaves people with a picture of support that doesn't include the people delivering it.
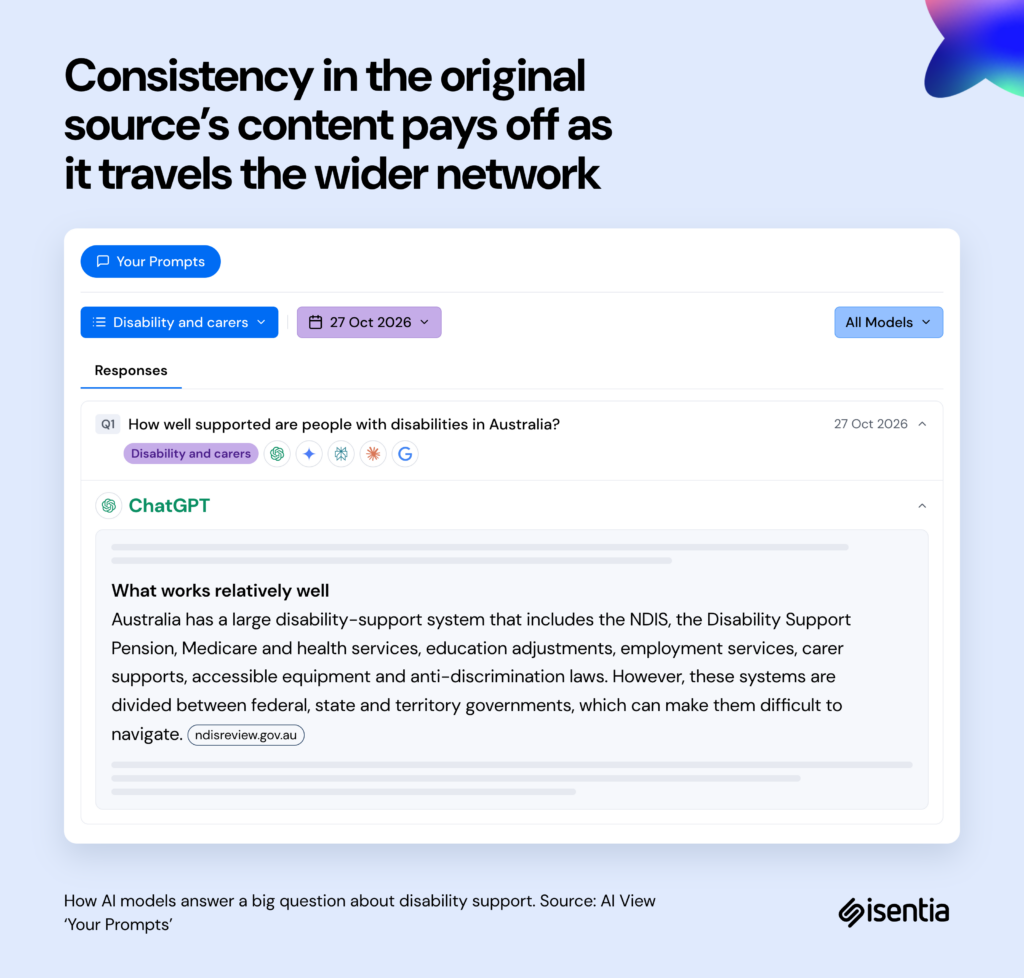
Questions about caring for someone played out differently. Every model gave almost the same answer and pointed people to the same national carer support service. When official information is clear and consistent across agencies, peak bodies and support services, AI repeats it faithfully. There was one notable exception, where a model explained the government's carer payments using a blog from a private company that sells personal medical alarms. The information was mostly accurate, but it shows how far an explanation can travel from its original source. The good news is that consistency across your wider network really does pay off: when the organisations around you describe your services the way you do, AI is more likely to get them right, and that shared story becomes part of your reputation.
Across all three categories, each model showed clear habits in the sources it reached for. We can see what each one cites, even if we can't see exactly how it decides, and the patterns are consistent enough to act on. In practice, your reputation can look different depending on the tool someone uses. These habits also build on what we found when we looked at how different LLMs represent your organisation.
| Model | Where it gets its information | Example from our research | What it means for communicators |
| ChatGPT | Official statistics, audit reports and formal reviews. It pairs almost every claim with a figure or finding, much like a policy analyst writing a briefing note. | When asked whether government support reaches people in need, it built its answer around the national audit office’s findings. It was also the model most likely to cite the website of the agency delivering a service. | Oversight reports shape how ChatGPT judges your performance, while your own pages shape how it describes what you do. |
| Claude | The widest mix of sources, including advocacy groups, provider guides and commentary alongside government material. It tends to explain the reasons behind an issue and present more than one side. | When describing the Royal Commission’s “national disgrace” finding, it relied mostly on second-hand accounts of the report, such as Wikipedia and a private aged care provider’s website. | The organisations that retell your story effectively become your spokespeople. |
| Gemini | University research and international bodies such as the OECD, drawn from Google’s broad index of academic platforms, video and international sources. | On aged care, it drew on an overseas policy institute’s summary of Australia’s new aged care legislation. | Published research and evaluations carry real weight, as do secondary sources describing your work, wherever in the world they are published. |
| Perplexity | The most recently updated pages, quoted closely. It is built around live search with visible citations, so it favours recent, easy-to-access pages. | On access to services, it quoted a government corporate plan published only weeks earlier. | This is where keeping your own content current pays off fastest. |
| Google AI Overview | A small number of sources, summarised briefly, because it is designed to give a quick answer at the top of search results. | On disability support, it relied mainly on the scheme’s own website and summarised criticism in general terms, without naming who made it. | The few sources it chooses carry a lot of weight, so clear, well-structured official pages give you the best chance of being one of them. |
Put together, the same question can produce an audit-style answer, an advocacy-informed analysis, a research summary or a current snapshot, depending on which tool someone happens to open. Two people asking the same question can come away with quite different impressions of the same service. There's no single AI view of an organisation to manage, because each model has its own sources and each needs a slightly different approach.
Look at any one of these answers and it can seem like a visibility issue. Put them together and it's a reputation issue. For public-sector organisations, reputation has always been about more than what's said about you by name. It rests on whether people believe the system works, know where to turn and trust what they're told, and those impressions are now forming in AI answers, one question at a time.
Across these questions, four things shaped the impression an answer left:
None of this shows up if you only ask AI about your organisation by name. You see it when you ask the questions your audience is asking. And it matters, because AI is now one of the main places where people go for information about the things that matter to them.
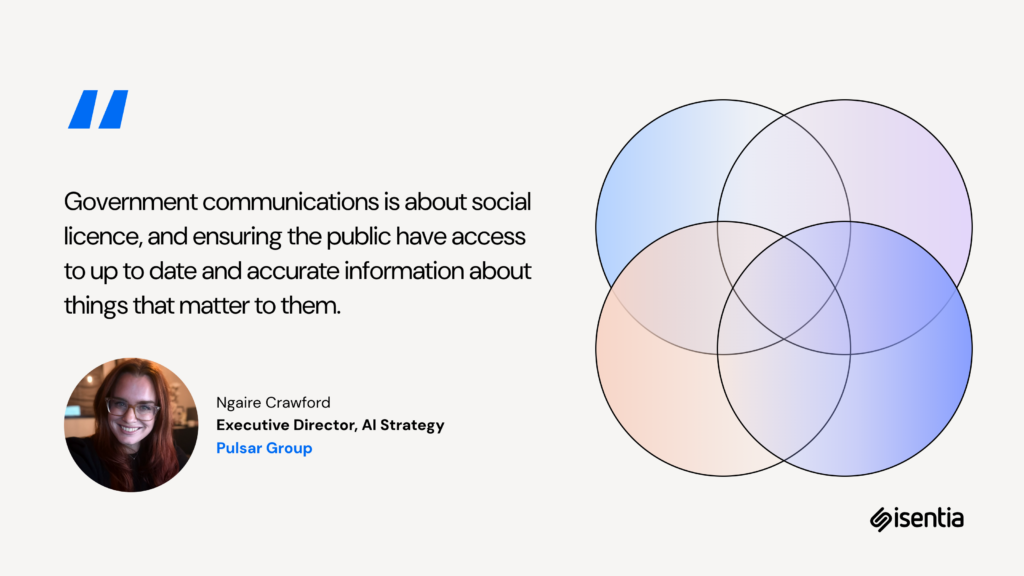
Government organisations can't control what AI says, but they can do a lot to influence the information it draws on, and with it the reputation that forms around them. Five practical steps came out of this research.
AI is already answering big questions about life in Australia, whether or not the public-sector organisations involved are part of the conversation. This research shows that an organisation can be mentioned often and still have surprisingly little say in how its services are described or how its performance is judged, with other organisations doing much of the explaining and each AI model weighing those voices differently.
For communicators, the job is to understand that wider network of sources and make sure accurate, current information runs through all of it. It's worth asking what AI says about your organisation. It's just as worthwhile asking what AI says when nobody mentions you, and whose information it's using to say it. That's where much of your reputation is now taking shape.
Want to see what AI tells people about the questions that matter to your audience? Get in touch about AI View.
" ["post_title"]=> string(63) "How do LLMs represent public services to the public they serve?" ["post_excerpt"]=> string(150) "Learn how AI cites government organisations, whose sources shape its answers on public services, and what public-sector communicators can do about it." ["post_status"]=> string(7) "publish" ["comment_status"]=> string(4) "open" ["ping_status"]=> string(4) "open" ["post_password"]=> string(0) "" ["post_name"]=> string(62) "how-do-llms-represent-public-services-to-the-public-they-serve" ["to_ping"]=> string(0) "" ["pinged"]=> string(0) "" ["post_modified"]=> string(19) "2026-11-04 01:49:36" ["post_modified_gmt"]=> string(19) "2026-11-04 01:49:36" ["post_content_filtered"]=> string(0) "" ["post_parent"]=> int(0) ["guid"]=> string(32) "https://www.isentia.com/?p=50662" ["menu_order"]=> int(0) ["post_type"]=> string(4) "post" ["post_mime_type"]=> string(0) "" ["comment_count"]=> string(1) "0" ["filter"]=> string(3) "raw" }Get in touch or request a demo.